
CHAPTER 3
FACILITATION AND EXECUTION OF THE ORGANIZATIONAL COGNIZANCE MODEL
I apologize upfront – this section does not have a lot of color or entertainment, though it is the most useful, hands-on part of the book. In this chapter, we are going to roll up our sleeves and explore the concrete ways that the Organizational Cognizance Model helps organizations build Cognizance among ICs and answer the all-important question we started with – who is doing what?
As we’ve seen, answering this simple question clearly and thoroughly is incredibly difficult for a 21st-century organization – unless it’s the size of Paul’s Painting Company, payroll of one. Just as medical imaging harnessed technology to revolutionize diagnosis, though, the 3-D Org Graph uses Graph Database technology to visualize organizational complexity and build Accountability with a new level depth and clarity and this requires some hard work.
TAKING AN ORGANIZATIONAL POSITION INVENTORY
[Note: We offer online self-lead video based learning courses on the following lessons and facilitations at https://learn.7q7p.com]
Applying the Organizational Cognizance Method and building your own Org Graph takes some work upfront, though once you’ve done that work, the system can become largely self-maintaining and self-improving. We’ll talk about maintenance in the next chapter, but first, I’m going to give you a series of straightforward exercises that will allow you to create an Organizational Position Inventory you will use to build Cognizance throughout the organization and to develop your own Org Graph.
These exercises don’t require much more than a whiteboard, some time, and the will to face the complex reality of how your organization actually functions. I said above that the Organizational Cognizance exercises are straightforward, and they are, but this doesn’t mean that they’re easy. They involve looking at everything that needs to get done or thought about at your organization – every year, month, week, day, hour, second – you get the idea – then grouping these items into the right buckets, and making sure that nothing is slopping out or missing buckets altogether, dripping between them or through the cracks.
As part of the process, everyone, from the CFO to the newest IC, must understand and embrace everything that he or she is responsible and Accountable for (remember, in the Organizational Cognizance Model we’re Accountable for thinking and responsible for doing). If you follow these Organizational Inventory exercises conscientiously and build your own Org Graph, you will be well on your way to Organizational Cognizance. You will have an organization where every IC understands the Positions she holds, as well as every Workflow, Process, and System she deals with. She will understand the function of every Meeting she Attends and exactly who she is CoachedBy. Her Teams, Objectives, Key Results, and all of the other complex Nodes and connections that the old Org Chart dumbs-down into a catchall box called “Job” will become crystal clear.
The Organizational Inventory of Positions I’m about to walk you through demands that we focus primarily on Positions. Jobs aren’t going away, but as we saw in the previous two chapters, Positions are the basic building block and starting point for the Organizational Cognizance Model. As an organizing principle, they are more precise and meaningful than “Jobs” and so, they give both ICs and leaders a clearer picture of who is doing what and how all the pieces connect.
As we’ll see, thinking of each Position in terms of its own Objectives, Key Results, Meetings, etc. is enormously helpful in achieving Organizational Cognizance. Focusing on Positions, however, takes a mental adjustment if Jobs and People are your usual frame of reference. My advice is to remember that every Job is made up of Positions (recall our examples for Sales Director and Marketing Director in the previous chapter), and follow a simple rule when doing the first of these exercises: no proper names.
People fill Jobs. Positions are a FunctionOf a Job that is Owned by a Person. Positions are not named after people and neither are Jobs. Imagine even your dinosaur Org Chart only having the names of people. That would basically tell you nothing except who you report to, certainly not why. We want to assess each Position on its own merits, functions, necessity, etc. Part of the Organizational Cognizance process involves determining which Positions might be duplicating work or serving no real Purpose, which ones are attached to the wrong Job or require Skills that the current Position owners don’t have. The whole point here is to step back and get outside the box, above the system for a fresh objective view. Describing a Position as “Tom’s Position” gets us nowhere and undercuts that effort. It’s also lazy and dodgy – watch for it.
| Lazy Thinking – One serious habit I am encouraging you to try to break is the one where you use a person’s proper name to describe the Position or Job that holds the responsibility or accountability. “That’s Tom’s Job” really means nothing and is lazy and really worthless language when you step back and look at this through the OCOG lens. Work hard to say something like this: “That is Tom’s responsibility from his Position X.” |
THINKING OR DOING POSITIONS
In the graphic below we are trying to point out that in our experience Jobs have Positions that can be defined as Thinking Positions or Doing Positions, and can sometimes be a combination where their Purpose Statement will describe a combination of both. The language we use is Accountable for Thinking, (Strategizing, mapping.) and Responsible for Doing (Following the proven method, the process, not really challenged with improving, just do it.) We find that it is important to make this distinction. As you go more to the center of the organization, where leadership lives, these Jobs will have more Strategy and Thinking Positions linked to them where the front-line Jobs and their Positions, the ones out in orbit, will have more Responsible, Doing Positions as a general rule.
One of the weaknesses we find is this, as an organization grows, it creates new leaders from the Responsible Doers who have helped grow the firm, and, often these Doers do not understand that their Job now includes Thinking Positions as well as their old Doing Positions. By sitting down with these leadership teams and running them through the Cracking Eggs and Pulling Teeth exercise, we are quickly and easily able to create a full inventory of the Thinking Positions the organization requires and assign these Thinking Positions to Jobs that are owned by the People around the table. This is a critical first step, because these Thinking Positons are Accountable for understanding the full OCM model as it relates to their Thinking Positions.
| Accountable for Thinking. Responsible for Doing |
| Cracking Eggs, Pulling Teeth. Flower Power |
 |
CRACKING EGGS, PULLING TEETH, MAKING OMELETS
[Remember, there are online video lessons on the following at https://learn.7q7p.com]
Best method for determining Team Accountability (thinking) Positions
I call the first of our Organizational Cognizance facilitations “Cracking Eggs, Pulling Teeth, and Making Omelets.” Yes, as the name implies, this one can get messy, even painful. To build our Org Graph and achieve Organizational Cognizance, we want to start with the inner ring in this exercise, the leaders around our Senior Leadership Team Table. This is the circle of people who hold mostly thinking Positions, those thinking about how and why we are doing what we are doing. From here, we’ll expand to the outer rings of the organization, but we have to get Accountability, domain, and authority for these key thinking Positions straight first.
CRACKING EGGS
- Make a list. Gather your senior leadership team (often, this is around eight people, give or take) to make a list on a whiteboard. Tell the Team to imagine that the table you’re sitting around has a round dome top. Imagine thoughts, ideas, and issues as ball bearings. These ball bearings drop from the sky and hit our dome-topped table. What are they going to do? They are going to roll to the edge of the table. We ask this question: “To keep this company running and to get it to the future, what do we need to be thinking about and doing every year, month, week, day, hour, second?” Any thought or issue that hits the dome-topped table is going to roll, and our goal here is to capture all of them with clear Positions, so nothing ever lands on the floor, slops over, or gets poured back and forth between Positions. List all of the things we need to be thinking about that can’t slip between the cracks and hit the floor on your piece of paper. This list should cover everything you do, touch, consider, decide, communicate – everything that takes time. Leaders typically come up with 15 or so items each. So, if we have 8 people making a list, we will have 8 x 15=120 items to put on the board.
- Extract items. Have a scribe extract the items on the team member’s lists by standing at the whiteboard and going from one person to the next, asking, what is the one item you want to add to the list this time around? If someone says “sales and marketing,” reply, “Nope, that’s two, I asked for one.” But still write these items down as the next two in the column before moving to the next person.
PULLING TEETH
- Group like items. The next step can get a little painful, though like a trip to the oral surgeon, the payoff is well worth it. We are going to group like items in order to establish Positions. Once you have your list, start at the top left and put a #1 next to the first item. (Note: the numbers here are completely random – we’re not prioritizing; putting a #1 next to an item does not mean it is the most important. We could just as easily use colors, shapes, or cartoon characters. The numbers are simply easy labels for grouping like items.) Ask the team to examine the items that make up your list, looking for things that seem to belong in the #1 grouping, or bucket. Have people identify similar items by calling out: “Column two, halfway down, item “x” is a #1. Place a #1 next to this item and the others the Team identifies as #1s.
- Common Question: “What if an item seems to fall into more than one bucket?” Normal question and simple, just put a dot (· ) beside the # which keeps it “open” – ·# (for instance, we could have one item labeled ·#2·#4, which means we believe it belongs to both of these buckets and might belong to a third #. The · just means the item is open to accept other #s.)
- Keep numbering. The next distinct item below #1 in the list will get a #2. Repeat the tagging exercise, with people calling out what else belongs in the #2 bucket and label those items with a #2. Move to the next unaddressed item down the list: it gets a #3. Find and label the other #3s, etc.
- Danger I: You will be tempted to skip forward and scatter your #3 and #4 and #5 across the board, Don’t! Stay in the first column when assigning your first round of numbers, so that it will be easy to locate the first use of the number when it’s time to name each grouping.
- Danger II: You will be tempted to name the numbers as you go along. Don’t! Naming comes later. The point of the exercise is to stretch your brain, to keep it open and only think in buckets, using the numbering system to communicate. “That is a dot 3” is the correct language. Saying, “That is Marketing” is being lazy and short-circuits the process. You will get pushback from your lazy thinkers here; don’t let the dim wits take over. Love, Walt
- Closing Dots Later: The first goal in this step is to go through the entire list, examining only the items that aren’t yet numbered. If something has a dot beside it, we will “close it out” with another number during the next pass. For now, just work to get a number or a number with a dot next to each item (see videos on this method at www.Organizationalgraph.com and www.7q7p.com).
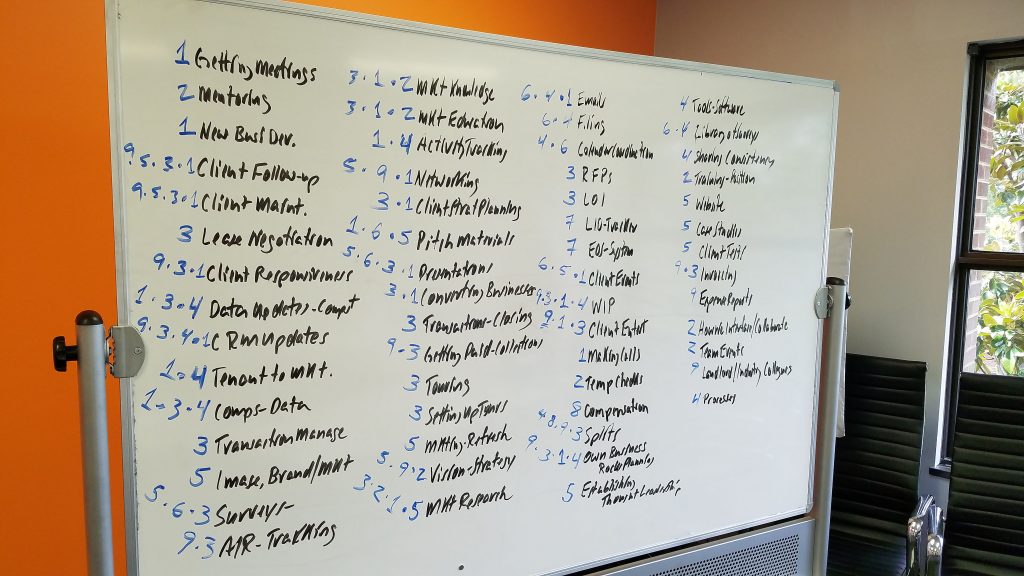
Examples of a couple of boards with numbers in process, Dots that are still open.
The table below reflects the first four rows and three columns of the photo above as a finished numbered and dotted close out.
| 1 Getting Meetings | 3·1·2 Market Knowledge | 6·4·1 Emails |
| 2 Mentoring | 3·1·2 Market Education | 6·4 Filing |
| 1 New Busi Dev | 1·4 Activity Tracking | 4·6 Calendar Coordination |
| 9·5·3·1 Client Follow up | 5·9·1 Networking | 3 R F Ps |
MAKING OMLETTS
- Name the buckets. The groupings, or buckets, that we’ve established are the framework for our Positions, which need to be named. Once every item is numbered, ask each person to take a sheet of paper and write the numbers down the middle, creating a left column area and a right column area. Label the left column “Humorous Position Name” and head the right column “Serious Position Name.” Have everyone take a few minutes to think about and assign names to the numbers / buckets on his or her list. Often, the humorous column will follow a pattern, movies, cartoon characters. Why have a humorous column? The point is to stretch your brains, stretch your thinking, naming them twice, from two perspectives, drives deeper understanding and creates better outcomes; don’t skip it.
- Next, pair people off by having them turn to the Team member to their left or right to discuss and compare lists. Each will typically agree to change a name or two as they compare their lists. Then have everyone turn to the person on his or her right or left side to discuss and compare lists. This gets people really focused and hurries things along. DO NOT skip this step.
- Split the group in two and have each half meet and come up with their favorite humorous and serious names.
- Set a whiteboard up with 4 columns and have a scribe from each group write his group’s choices for these bucket names on the board.
- Discuss the ideas with the whole group to find agreement on the best names. You might have to put some to a vote. Remember, this is still draft time. Nothing here is final, so don’t sweat it. Also keep in mind that sometimes the humorous name is selected because it actually captures the essence of the position.
- Serious name tip: I have some clients who like to add “This is how we (fill in the blank)” to describe the essence of the thinking that will be filled by a leadership team member via their ownership of the thinking Position as a Function of their Job.
- Close out items. Once you have this preliminary list of Position names, use it to “close out” the items with numbers and open dots, the things we couldn’t definitively assign to one grouping the last time around. This means going back to the big list and armed with your bucket names and new understanding, adding a new number to an item that’s still open (for instance, using the table above, let’s say “·4 Activity Tracking” was hazy last time around but now agree the ·4 will be closed out by adding a 1; we add the 1 and now we have “1·4 Activity Tracking” and we say it is “closed”, no open ·s.) or erasing the dot next to an existing number (we weren’t sure if this was a 2, thus the dot, but we now agree that it is). Some items might belong to more than one group. If so, add another #. Assigning numbers to open items will be easy this time around because you will have a better handle on the groupings. You will find that some open dots are not covered with your current list, add a new #, name it on the fly and use it to close those dots. Normally 2 or 3 new numbers/positions are added during this close out exercise.
- DANGER: Resist the urge to cut the list down, grouping and eliminating numbers / buckets. This exercise is all about getting granular.
- Discuss Named Positions. If you’ve been thorough in the steps above, the numbered “buckets” we just named on the board are the framework for your thinking Positions. In my experience, as I said, senior leadership teams typically have 10 to 14 vital thinking Positions after completing this exercise, sometimes as many as 25, depending on the complexity of what they do. As a group, talk about these Positions. Verbalize what you think the Purpose Statement for each should sound like. Do the buckets, or Positions, seem airtight? Do they clearly define the owner’s Purpose, domain and authority? Remember, you don’t ever want a ball bearing, or an issue, to roll off the table, slip between positions, and hit the floor. Nothing should get missed or neglected. It can’t land and get passed back and forth between positions either (when everyone’s Accountable no one’s Accountable). And it can’t fall into a position that’s completely full and has no additional capacity – another recipe for neglect.
- Assign Positions to Jobs (in essence, the leaders at the table). Now that the thinking Positions have been clearly established, assign them to Jobs in a way that senior leaders agree makes sense (remember, you’re technically assigning to Jobs, not names or people at this point). For instance, you might determine that Positions named Social Media Strategies, Marketing Tactics, and Ad Budgeting all belong to the Job called Chief Marketing Officer. The Person who currently fills that Job owns all of those thinking Positions, and everyone now knows it. Another Position called Risk Management belongs to the CFO Job. Other people can and should still think about risk, but the CFO owns this Position. It is his domain, and he has the authority on risk. The buck will stop with him on this issue, and everyone knows it.
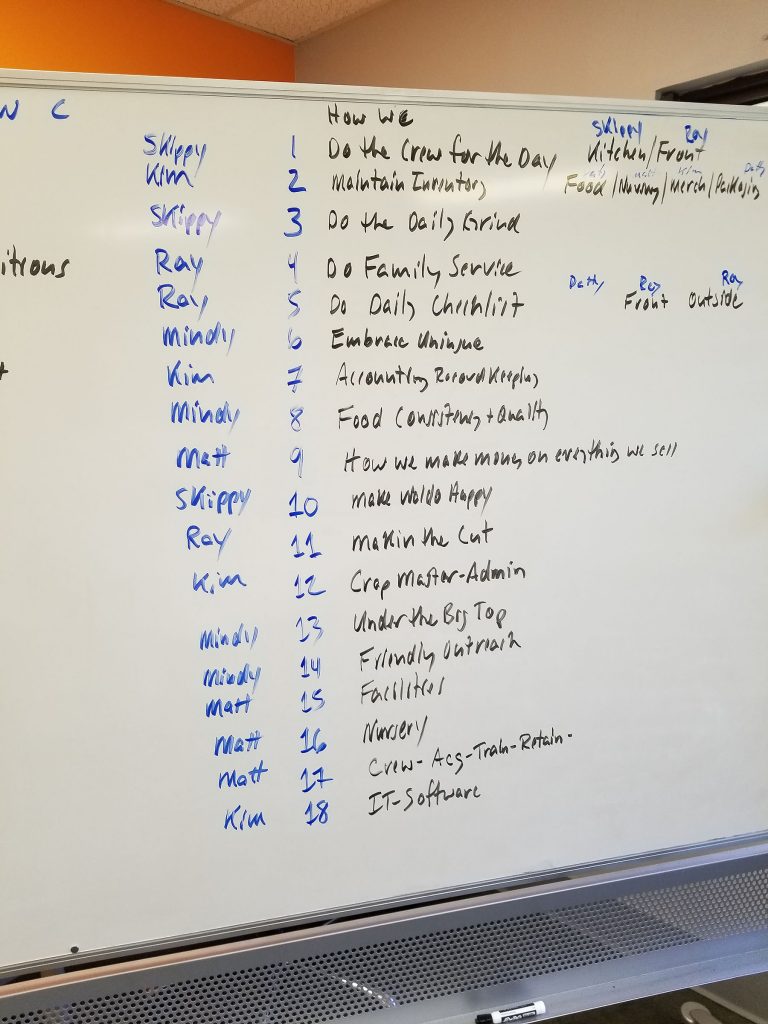
Example of #s Named, with a person linked to each. This is a real company’s list.
Leaders will leave this facilitation with a much better sense of everyone’s domain, authority, and Purpose when they are meeting around their leadership table. People will be Cognizant of the fourteen or so things that absolutely have to be thought about strategically and dealt with monthly, weekly, daily, hourly – and exactly who is Accountable for thinking about each. Bobby owns the Job of CFO, so he is the keeper of our strategies regarding risk. Bobby knows this, and if anyone has a question or concern involving risk, they know that Bobby in his CFO Job is the Person to talk to.
When Bobby worries about something that raises our risk profile, everyone is also Cognizant of the fact that he’s approaching the issue from his Position of Risk Management, and they appreciate the thinking this involves. Bobby, in turn, knows that Lisa, the Chief Marketing Officer, is approaching the same issue through her Position of Marketing Tactics and the risk thinking that underlies it. Their interaction is more informed – and often less tense – because, excuse the cliché, each is Cognizant of the other’s Position, and thus where the other is coming from.
As I wrote in the previous chapter, the sailor in me can’t help thinking of this dynamic in terms of what, in navigation, we call “triangulation.” You see something from a particular Position, your bearing; somebody else looks at it from their Position, or bearing, and together, you can get a precise fix on that thing. The Team is more focused, and if Positions are being taken seriously, tasks stop slipping through the cracks.
THE ORGANIZATIONAL COGNIZANCE POSITION CAPTURE WORKSHEET
In the Organizational Cognizance Model, the Worksheet below is used both with senior leaders, who hold largely thinking Positions; and with the farthest rings of frontline workers, who hold mostly “doing” Positions; and everyone in between. We’ll get to the farther rings of ICs in a moment, but for now, let’s stick with the senior leaders.
| Organizational Orbits – You will hear the words rings when I describe organizations. We help our client think of their organizations using the analogy of a solar system or an atom, both have orbits around a center. We have rings that radiate out from the center that represent levels of the organization. You could say the sun at the center represents the Sr. leaders and the planets are Jobs and Positions orbiting the sun. Every now and then we might even have a comet that swoops in, cutting across orbits, that might be the board. |
After the Cracking Eggs, Pulling Teeth, and Making Omelets exercise above, leaders then individually fill out an Organizational Cognizance Position Capture Worksheet for each Position that is a FunctionOf of the Job they Own. You’ll note that the categories on the Worksheet track the “Nodes” we introduced in the previous chapter. A simple Excel spreadsheet works well for collecting this data, which will provide the foundation for your Org Graph.
We should note that some Positions might not need to connect to every Node in the model. There could be a Position, for example, that is not a MemberOf any Team or that doesn’t Attend any regular Meeting. In such cases, the space for Nodes that don’t apply can simply be left blank.
Don’t let Position Capture overwhelm you. As a general rule, every Position should have at minimum a Purpose Statement, a Long-Term Objective success measurement, and a list of Short-Term Results that must be pursued. This is your starting point, the highest-priority Nodes, the heart of any Position and the three most important things to tackle.
Defining and naming Positions through the exercises above is a good start, but don’t make the mistake of assuming that this means people are truly Cognizant of them. The Organizational Cognizance Position Capture Worksheet helps everyone, leaders and ICs alike, to dig deeper, interrogating each Position he or she owns, thinking about why it exists, what it should accomplish, and every Node it connects with – all relevant Meetings, Systems, Processes, Workflows, etc.
I have argued throughout this book, that an organization is a fiction, given power by those who believe in it. This does not mean, however, that we should expect blind faith. The belief I’m describing is a result of knowledge, awareness, and connection. If people don’t understand on a deep level what they’re being asked to believe, faith is impossible. The Org Graph that we’ll build from the Organizational Cognizance Position Capture Worksheet acts as a kind of organizational bible, shining a light on how things work and providing a map for how to operate. Like a bible for the faithful, the Org Graph is also a living tool, a place to turn for answers, a daily source of revelation.
Belief demands Cognizance, as I said in Chapter 1, and unpacking each Position is a key step to building both.
POSITION PURPOSE STATEMENT
The Position Purpose Statement is the first and most important line in the Worksheet. To get to Organizational Cognizance, people must understand the Purpose of each of their Positions and not simply of their overall Jobs. I advise leaders to follow Simon Sinek’s simple yet powerful formula to craft these Purpose statements: Why? How? What?
If you’re familiar with Sinek’s work, you know that he argues that the Why, or Purpose, should be the first priority for any business or organization – and I would add, for any Position. Take his advice and “start with Why.” Why does this Position exist? What is its Purpose? Why is it important to my Job and to the overall mission of the organization?
Leaders are generally familiar with the What – closely connected to the Objectives listed in the Worksheet below. What should this Position achieve – whether that’s a particular standard, a kind of service, or a product? Finally, think about How we get there? How do you go about fulfilling a particular Position’s Purpose and reaching the What? This question is closely tied to the Results column in our Worksheet.
These Purpose statements are important, but they must also be simple and succinct. One to three sentences should do it. Here are a couple examples drawn from our hypothetical leaders above:
The Purpose of the Social Media Strategies Position is to boost our online presence and leverage word of mouth to augment our marketing efforts with minimal expenditure. This is mostly a Thinking Position where I am tasked with thinking and strategy around how the organization does Social Media.
The Purpose of the Risk Management Position is to be accountable for identifying and evaluating risks organization-wide and then responsible for executing strategies and applying resources to minimize them while maximizing opportunities.
The Purpose of this Position X is primarily accountable for thinking about and forming strategies and processes that the organization can form around and follow to execute.
The Purpose of Position Y is primarily responsible for executing the plans and following the processes that are determined in Position X.
For more robust examples visit www.ocog.io or www.organizationalgraph.com where we are building a shared library you an resource.
Why, What, How, use your common sense, your common judgement here. My grandfather, who owned a classic general store in a one-stop-light town in the early 1900s used to tell a story of three older gentlemen sitting on the front porch of the store in rocking chairs, playing chess and watching the world go by. Along came Billy Williams, fresh from university, driving by in his new Chevy convertible…One rocking chair gentleman said to the group: “Well, thar goes Billy Williams, he’s got a ton of book larnin’ but not a lick of common judgement.” Don’t overthink this stuff.
Basic Organizational Cognizance Position Capture Worksheet
| Position Name: | ||
| Name goes here. | ||
| Position Purpose Statement: | Job Function Of | (complete these fields, comma separated) |
| Write your purpose | Objectives | |
| paragraph in these spaces. | Key Results | |
| Coached By | ||
| Meetings | ||
| Teams | ||
| Systems | ||
| Workflows | ||
| Processes | ||
| Systems | ||
| Entities | ||
| Skills |
Basic Organizational Cognizance Job Capture Worksheet
| Job Name: | ||
| Name goes here. | ||
| Job Purpose Statement: | Job Reports To | (complete the fields below, comma separated) |
| Write your purpose | Objectives | |
| paragraph in these spaces. | Key Results | |
| Coached By | ||
| Meetings | ||
| Teams | ||
| Systems | ||
| Workflows | ||
| Processes | ||
| Systems | ||
| Entities | ||
| Skills |
COMPLETING THE WORKSHEET
Refer back to our list of Nodes in Chapter 2 for help filling in each of the columns in the Organizational Cognizance Job / Position Capture Worksheet above. Most are fairly obvious, though organizations might use some terms differently than we do in the Organizational Cognizance Model. “Objectives,” for example, refer to big-picture qualitative stuff in the argot of Organizational Cognizance – strategic thinking, planning, execution of long-term goals. “Results” are more quantifiable – a sales volume, a client retention percentage, the number of new accounts per quarter. Some readers might use these words interchangeably in daily life, so the distinction is important.
We are AccountableFor Objectives (emphasis on thinking) and ResponsibleFor Results (emphasis on doing).
Workflows, Processes, and Systems are also closely related and might cause confusion for some readers, depending on how those terms are used at their organizations. In the world of Organizational Cognizance, you can think of a Workflow as a river. What route does work take as tasks or information flow from one IC, department, unit, etc. to another for some action as your organization adds value to a product or service? Processes are like docks along that river route, where a boat might stop for fuel, food, a paintjob, a cargo inventory, new maps…These are the protocols that get followed to move a task through the workflow. As noted earlier, Step 1 in a Workflow is often to follow Process A, Step 2 involves Process B, etc. We ParticipateIn Workflows and Follow Processes.
Our many Systems involve inputting data or work of some sort to have a function performed or info tracked (think Salesforce.com, Quicken, Google Hangouts, etc.). The Workflow of servicing a new client would involve a variety of Processes, the first of which might be entering them into your CRM System. The connections between Nodes, as you can see, is complex and often difficult to picture clearly (impossible on an Org Chart). The Organizational Cognizance Position Capture Worksheet helps us think about the moving parts inside each Position individually, how they relate to each other, to the Job, the Person, and the organization.
Words, however, can only do so much. The real magic occurs when this data is transferred into a 3-D Org Graph that allows people to visualize all of this complexity – the soup they swim in daily – in a way that’s clear and comprehensible at a glance.
THE FLOWER POWER EXERCISE
[Remember, there are online video lessons on the following at https://learn.7q7p.com]
Best method for determining IC Responsibility (doing) Positions
We started with the inner ring, the thinking Positions that steer the ship, by having leaders do the Eggs, Teeth, Omelets exercise and fill out Organizational Cognizance Position Capture Worksheets for each of their thinking Positions. Once those Positions have been established, we do a similar exercise for all ICs, leaders to line workers, to get a grip on their Positions and build Cognizance throughout the organization. Here’s how the Flower Power exercise works:
- Gather a group of ICs with the same or very similar jobs who work together. If, for instance, the organization has four Client Service Agents, they would make a group. Include a supervisor or manager in this meeting to facilitate, but make sure it’s someone close to the work, with direct knowledge of what’s going on. Caution: bringing in someone who’s two levels removed can do more harm than good here.
- Decide randomly who you will start with and write that person’s name in the center of a circle on a whiteboard. Let’s say that Skippy is going first.
- The Cracks Question: Now ask the team to reflect on what Skippy does, everything that she’s thinking about and doing – every month, week, day, hour, second. What are all the things on Skippy’s plate that have to get done or thought about, that can’t fall through the cracks? Have people make a list and have Skippy do the same.
- Extract and Group on the Board: Next, go around the group and have each person share one thing that Jill does. The first person might say, “answering client calls.” Write that on the board. The next person might say, “sending welcome packets to new clients.” Write that in another area on the board. If the next person says, “answering client emails,” you might decide as a group that this belongs in the same area as “answer client calls.” Jot it down there.
- Keep going around: Keep going around the group, jotting down list items and grouping similar ones in the same area on the board. By the time you’ve gone through everything that Jill does – all that she thinks about and every task she completes every second of every day – and grouped them in similar areas, you might have half a dozen or so of these buckets / groupings.
- Petals: Finally, loop each group back to Jill with an oblong line that surrounds it anchoring both ends on the central circle. The resultant diagram will look like a flower with long petals – thus the name of the exercise. The petals are Skippy’s Positions, each of which is looped back to the center, to Skippy, where they overlap with each other to form her Job.
- Number the petals and go through the naming exercises and Organizational Cognizance Position Capture Worksheet as explained in steps 10 and 11 of the Eggs / Teeth / Omelets exercise above.
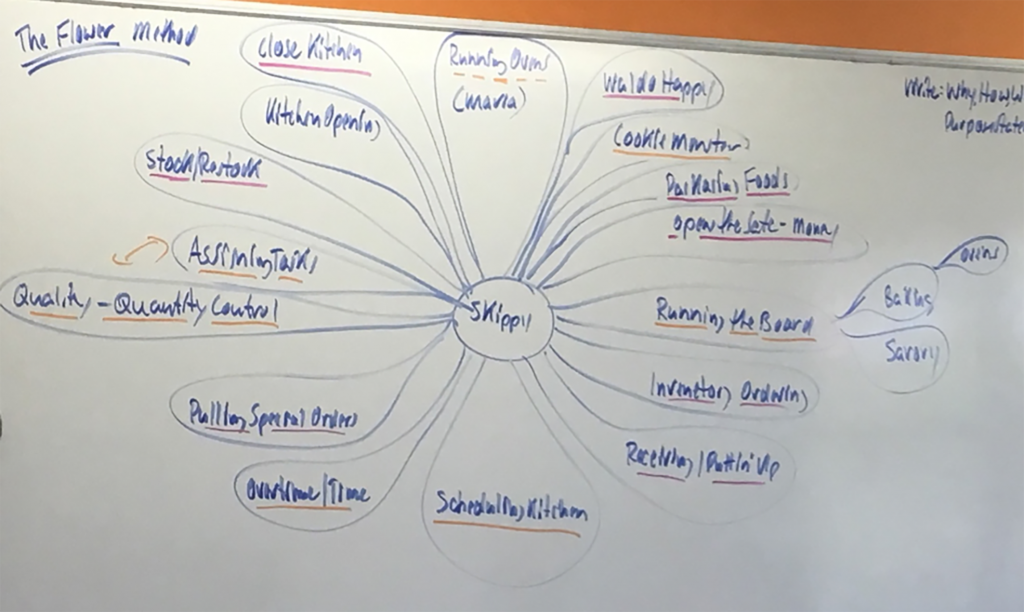
An example board of a Flower exercise showing all the things that take up Skippy’s day. It is hard to see in black and white but there are orange and red underlines that are identifying / Positions that need to come off Skippy’s plate. Like Opening Safe, Stock/Restock, Receiving, Packing Foods, Pulling Orders all things she knows how to do, but, needs to give up. We have more photos of boards at www.ocog.io
Like the Cracking Eggs exercise that began this chapter, the Flower Power Exercise allows you to establish the Positions that make up Jobs, in this case for the outer rings of your organization, the Positions that impact ICs the most. After clearly defining Positions in this way, everyone leaves the room with a deeper understanding of his or her own domain, authority, and Purpose – along with everyone else’s.
As with the leadership Team in our earlier example, in this one, the Client Service Agents are now deeply aware of the priorities that must be acted on or thought about every month, week, day, hour, and second. And they now have clarity on exactly who is Accountable for doing or thinking about each of those things (note that in the Organizational Cognizance Model, we’re continually answering Peter Drucker’s key question: Who is doing what?).
Questions of time capacity will inevitably arise during this exercise, too. Building and then reviewing these Flower Diagrams, for instance, our hypothetical organization’s Client Service Agents might determine that Jill’s Positions are too full and things are slipping through the cracks, while Ron has room to do more. If people are overwhelmed, not pulling their weight, out of their lane, etc., it’s much more likely to come to light in discussing Positions as we build our Org Graph than in reviewing Jobs on an Org Chart.
After the Flower Power exercise, ICs should write a Purpose Statement and fill out an Organizational Cognizance Position Capture Worksheet for each of their Positions, just as leaders did after the Cracking Eggs exercise (see above). I won’t reprint the Worksheet here or repeat how to fill it out, since the sheet and process are exactly the same for delivery drivers as for the CFO and should be leveraging common sense.
Yes, everyone at the organization has to fill one of these out for every Position he or she holds in the Organizational Cognizance Method. Is it really important for a receptionist or groundskeeper to be Cognizant of their Purpose and Positions? Do they really need Coaches? Yes, yes, and yes. As I’ve said many times now, an organization is a fiction, only given meaning and power by those who believe in it. To be a Cognizant Organization, that belief must extend from the corner office to the factory floor.
Why? For starters, today’s mailroom worker might very well be tomorrow’s comptroller or vice president of sales. This is real. One of my client’s, Julia, started as a receptionist at Allina Health in Minneapolis, MN and now holds a VP position. She started fresh out of school in 2007 and worked her way up – amazing! All workers want to say, yes, they feel that they are being developed – the sixth of the Seven Questions critical to cultivating culture and engaged team members. Building Cognizance among frontline workers helps you to build a bench, maximize resources, and groom leaders in-house. It also boosts motivation and engagement throughout the organization.
More important, though, the foundation of the Organizational Cognizance Model and the Org Graph is transparency and clarity for all ICs, the entire organization. When you begin thinking that Cognizance is only for leaders or for ICs above a particular paygrade, you might as well return to the old Org Chart. In that case, you are essentially taking the Blue Pill, to recall our Matrix example, dozing off, and allowing people to believe whatever they want.
Any place that you decide doesn’t need Cognizance – the reception desk, loading dock, mailroom – becomes a blind spot, a potential haven for dysfunction and a drag on the organization. It only takes one blind spot to cause a traffic fatality, one short circuit to screw up an entire electrical system. The whole premise of the Org Graph is that organizations thrive with a full 360-degree 3-D view. The Org Graph is an incredible tool, but it is only as good as the data it’s built on. Building a good Org Graph means everyone working hard on the exercises above in a spirit of openness and inclusion.
BUILDING AN ORG GRAPH
After you complete the Organizational Cognizance exercises and Position Capture Worksheets, you can begin building your Org Graph. I have said from the start of the book that you do not have to use our Organizational Graph software to build your Graph, and that’s true. You do, however, have to find a way to visualize the complex organizational data you now possess. Lists and spreadsheets won’t get you to Cognizance. Neither will static diagrams.
You need a way to see all the relevant Nodes (Workflows, Systems, Processes, Coaches, Meetings, Teams, etc.) and their unique relationships, or Edges (ParticipatesIn, AccountableFor, Owns, InteractsWith, Attends, etc.) clearly, at a glance. Yet another list or spreadsheet will add complexity not clarity to the plates of overburdened ICs. It will become another “Slogin,” as my client says, on the already enormous list of apps, Systems, communications channels, etc. that ICs navigate on a daily basis. This is the opposite of what we want to do in the Organizational Cognizance Model.
Furthermore, ICs and leaders must be able to interact with and manipulate the data under this visualization. To move you toward Cognizance, the visualization must reflect the reality of how your organization and its ICs function – that’s the whole point. If your organization is anything like the hundreds I’ve worked with over the years, then it functions in ways that are complex – dare we say messy – and constantly evolving. Team members must be able to see this reality in real time, not some idealized or dumbed-down version of their Job that’s perpetually out of date. They must see the big, organization-wide picture and be able to zoom in on the parts of the visualization relevant to questions they have about a particular Team they’re a MemberOf, a Meeting they Attend for Position A, a Coach who offers advice on Position B, a System they InteractWith out of Position C…
A static diagram can’t capture the complexity of a single Position, much less the hundreds of interrelated Positions and thousands of relationships that make up even a small organization. If you’re attempting to capture what we’ve been talking about in a static two-dimensional diagram such as an Org Chart, you are more than likely frustrated. An Org Graph must be three-dimensional, yet easy to use and comprehend. A new hire should be able to interact with it on her first day, maybe even before her first day, since, you’ll recall, fast onboarding is one of its chief benefits.
The list of criteria I’ve just named has enormous benefit for the user – an IC trying to understand her Positions, how her organization actually functions, how she fits – but it’s a tall order for the software developer. In refining the Organizational Cognizance Model over the years, even I knew that, and I am by no means a software expert, or even much of a computer guy. From working my first job in accounting to running multiple businesses to coaching organizations today, I have learned whatever computer magic I needed as I needed it. If I had a problem, I looked for a digital tool that could solve it. I don’t browse for apps or systems or new communication channels unless it’s to address a specific issue. Life in a modern organization is complicated enough (see Chapter 1). Who has time for an app solution in search of a problem?
In the case of the Organizational Cognizance Model, I had a significant problem – how to visualize all of the complex organizational elements and relationships we’ve been discussing, the stuff I have spent years coaching leaders about, in a way that met all of the criteria above. I have been using the exercises and Organizational Cognizance Position Capture Worksheets presented in this chapter for some time, and they are always helpful, but I knew that without a way to visualize, interact with, and constantly update organizational dynamics in three dimensions, our other tools would continue to fall short on delivering true Organizational Cognizance.
ON A NAPKIN, LIKE EVERY GREAT SOLUTION
I mentioned this challenge to a family friend, Elias Hicks, a twenty-seven-year-old Princeton grad and data wonk who had moved back to North Carolina’s Research Triangle and was looking for a job. We met at a Starbucks to talk over his career options and which contacts I might introduce him to. Once we that conversation wound down, I sketched the Organizational Cognizance Model on a napkin, explained what I wanted to achieve, and he immediately said, “Oh, that’s a Graph Database. It’s a perfect fit. I can model that up for you in Neo4j.”
I hired him to build a basic model. Once I saw the way that Graph Database technology worked and shared it with a few clients, we understood that this software solution was exactly what we were looking for.
THE MAGIC OF COLLABORATION
I put the project out to bid, and, unfortunately, building even a basic Graphic User Interface with the functionality we needed was exorbitantly expensive. My dream seemed to be dying on the vine. Like a dog fixed on a bone, though, I was not willing to give up that easily.
One day, I found myself browsing around deep inside some AWS information, and I stumbled across a Berkley-based software company called Tom Sawyer Software that had roots in IBM Watson and three decades of data and layout experience, with a client list that included the likes of Toyota, 3M, and Boeing. They happened to be rolling out a dazzling new Graph Database product called Perspectives, which was an ideal solution for the Organizational Cognizance Model. My challenges, in turn, were of exactly the type that Tom Sawyer wanted to solve with Perspectives. I “LinkedIn” to their CEO, Brendan Madden, gave him a call, quickly explaining what I had in mind, and Brendan said, “Let do it.” Madden and I formed a collaboration, a joint venture, and the Org Graph was born on my years of organizational structure experience and Brendan’s team of world-class developers. It now lives at https://ograph.io.
CLICK, DRAG, BUILD
Tom Sawyer Software is very much under the hood and behind the scenes when it comes to ograph.io, our Organizational Graph solution, and the Organizational Cognizance Model. I bring this up to give credit to a talented partner who helped build and now supports exactly what we need to replace the old Org Chart and achieve Organizational Cognizance.
I’m also sharing this journey in order to highlight all that’s needed for an effective Org Graph and to acknowledge that this is a team effort. There might be another way to build an Org Graph and effectively visualize the Organizational Cognizance Model short of spending millions of dollars to develop your own basic user interface for an existing Graph Database program. However, we are not aware of anything as of this writing that has a Graph Data Model built from real-world, real-team, real-IC experience coupled to a world-leading platform.
ADP, the big payroll giant, is rolling out a “Skunk Works” project that includes a graph approach to team visualization, showing Persons on Teams. This is super exciting for us. Why? Because in my experience, if you have a great “unique” idea or solution, someone somewhere out there in the world likely has the same idea. Unless that someone is a troll in a hole, you have an opportunity to ride that solution wave together. ADP is certainly not a troll.
The Org Graph Data Model and software solution we have developed meets the criteria we have outlined with flying colors. It allows ICs to visualize all of the complexity of their Positions and Nodes and the web of connections linking them in ways that are clear, interactive, and easy to digest. Our software makes it simple to build your own Org Graph (you can have a basic structure done, literally, in minutes) and to update it in real time.
Someone once said that writing about music is like dancing about architecture (if you are having trouble with this metaphor, picture the hated mime, acting out on a street corner what a building will look like). Writing about software is equally awkward and inadequate. The best way for you to see how our Organizational Cognizance software works is to take five minutes and go to https://Organizationalgraph.com and https://orgaph.io. There, you can watch a couple of short demos that walk you through the simple process of getting started on an Org Graph of your own. You can also take the system for a test drive and play with the features.
As you’ll see at our website, the Organizational Graph software presents you with a big blank pallet, or canvas, to start. We have a menu across the top, one down the middle, and an outline of your work with filter options down the left side. The interface functions a lot like Photoshop. The top row allows you to interact with and visualize what you create on the canvas in various ways. The menu down the center is your drop-and-drag objects menu, the bottom icon is the Edges tool you use to connect Nodes. On the left are interactive outlines that represent the Nodes and Edges we have arrived at through our exercises and Organizational Cognizance Position Capture Worksheets – Person, Job, Position, Objective, Key Result, Team, Meeting, Workflow, etc.
To get started building an Org Graph, a user simply clicks on a Node icon from the middle object menu, drops it on the drawing pallet, and then connects it using the simple, intuitive Edge tool – at the bottom of that same menu. This tool allows you to draw a line between Nodes and show the nature of the relationship. Click on the Node for Person and then click onscreen, and the Person icon pops up (we introduced these icons in Chapter 2). Click on the Job Node and then on screen, and a Job icon pops up. Use the Edge tool to connect them and a line automatically appears, labelled Owns: this Person Owns this Job.
INSIDE EACH NODE LIVES RICH, SEARCHABLE DETAIL
Rich, searchable details and text lie underneath each and every Node. It’s super important to create a universe of color and depth in each Graph Node. Right click on your Node to rename it, write a short description, color-code it, upload a video or file, link it to a file or outside URL. Choose the Rich-Text tab and you can add searchable Rich-Text pages that support not only the text of your choice but also embedded videos, links, picture, files, etc.
From here, users simply click to add and drag to connect the Objectives, Key Results, Teams, Meetings, Workflows, etc. attached to that Job. Next to one Job, you can click to create another Job that the first Job ReportsTo, and then another that this Job is MentoredBy, since the reality is that we’re not always mentored by the person we report to.
From each Job, you can then click to create the Positions connected to it, labelled with the Edge FunctionOf. Around each Position, click on Nodes and Edges to quickly create all of the Meetings, Workflows, Teams, Processes, Systems, Entities, Objectives, etc. attached to it. All of this data has been established through our Cracking Eggs and Flower Power exercises and the Organizational Cognizance Position Capture Worksheets in this chapter. With a couple of clicks, you can create visualizations for the attendee list associated with a Meeting Node, a diagram associated with a Workflow, a video link related to a Process, a checklist linked to a Position…
Simple, right? Well, it’s even simpler once you’re in the Organizational Cognizance software and clicking away, which is why I’m encouraging you to go to https://ograph.io for a better demonstration than I can provide in these pages. Within a few minutes, you can create a visualization that captures the complex web of an IC’s Job and Positions, her many functions and connections within the organization.
I am not even going to touch on many of the features built into the Organizational Cognizance software, including the multitude of views and layouts – symmetrical, circular, classic, hierarchical, orthogonal, etc. – that allow you to see Jobs, Positions, and the organizational structure from various useful perspectives. Switching views takes only a mouse click, but the new point of view that results from the shifting of Nodes and Edges – a kind of 3-D organizational ballet on your screen – is one of the more impressive features of our Graph Database software. It must be seen to be appreciated, and I don’t want to muck it up by attempting to capture it in words.
With filters, we can declutter or drill down into the particular view and information we want. Just go to the left-hand objects outline area and click on the word “filters.” From here you can check boxes with a click to hide or show whatever Nodes and Edges you want.
A leadership team or hiring manager can color code the Org Graph to envision different scenarios, creating almost endless opportunities to learn more. By the time this book is out, we also will be embedding analysis tools that you can use to, well, analyze your organization.
It all starts with doing the Organizational Inventory work in this chapter.
Having an IC start a new Job with access to this clear visualization of exactly where she fits and how things function – every Meeting, System, Process, and Workflow she touches – accelerates on-boarding and ROI, boosts performance and Accountability. Once every Job and Position is accurately represented in a 3-D Org Graph, the benefits multiply exponentially as you achieve Organizational Cognizance. In the next and final chapter, we’ll explore the benefits of an Org Graph and the Organizational Cognizance Model, and how to maintain them.