FLEXIBLE, DYNAMIC ORGANIZATIONAL GRAPHS
Strategizing around Positions is also more flexible than focusing solely on Jobs. Jobs, like Org Charts, tend to be static. Jack, the new Sales Director at our janitorial supply firm, will probably have that same title, “Job,” and slot on the old Org Chart for the duration of his time with the company, unless he takes another Job within the organization. Meanwhile, his Positions might shift substantially. A year from now, for instance, a new Position could be added to his list, and an existing Position, say Sales Team Training, could be turned over to a new Job, Assistant Sales Director. This doesn’t necessarily mean that Jack will be removed from all training activities, but everyone at the organization would know that Bob, the new Assistant Sales Director, now owns the Position: Sales Team Training. That’s his Position; his domain and authority, what he is Responsible and Accountable for. He is in charge of the Objectives related to it and will live and die by the Objectives and Results we achieve through Sales Team Training.
Once the Assistant Sales Director takes over the Position called Sales Team Training, Mike, the Sales Rep in our example, will be able to see this adjustment in the Org Graph, reflecting the new reality. If Mike has a part in Sales Training, or suggestions or complaints about it, etc., he will interact with Bob on those issues, though he still reports to Jack on most fronts. Similarly, to return to the sports parallel, when I play the Position of Center on offence, I am CoachedBy the Position of Offensive-Line Coach, and when I’m in my Linebacker Position on defense, I am CoachedBy the Defensive-Back Coach Position.
None of these nuances get captured on the rigid Org Chart, which leaders often think of as presenting a skeletal view of an organization. That’s actually a pretty good metaphor. For a quick broad glance at organizational hierarchy – the skeleton beneath the headstone – the old Org Chart is useful, though less and less so, since organizations are less rigidly hierarchical and fixed than they used to be.
Like a model skeleton, the classic Org Chart leaves out the nervous system, circulation, respiration, muscles – the living tissue that allows an organization to function on a daily basis. The Org Chart is like an annual old-school X-ray that doesn’t change much year to year. Think of the Org Graph, by comparison, as high-resolution 3-D medical imaging updated in real time. It shows all of the systems, types of tissue, and fine gradations in ways that make the incredibly complicated processes responsible for organizational life digestible.
The continual updating of Positions as opposed to Jobs was front and center for me at Layline, the dot.com I started and ran for twenty years, though I didn’t yet have an Org Graph. Our selling cycle was very seasonal, with sales ramping up in mid-March and then slowing to a trickle come fall. We had ICs whose Positions would switch from phone work to vendor relations to copy editing depending on the time of year. Their Jobs and titles would remain the same on any Org Chart, but a dynamic Org Graph, based on Positions, would have reflected those seasonal shifts.
Whether Positions shift because of seasonal / cyclical patterns, team realignment, new business, new client demands, new projects, or other reasons, the Org Graph can create and maintain Cognizance even in rapidly evolving environments where Positions shift on a dime.
GRAPH DATABASE. AKA: “A Graph”
A simple Graph is made up of Nodes and Edges (aka Connections, Relationships), and each of these Nodes and Edges have Labels and Properties.
| Labels | Properties | |
| Nodes (aka Objects) | Node Label | Node Property |
| Edges (aka Connections / Relationships) | Edge Label | Edge Property |
Popular Graph Developer Programs include Neo4j, Amazon’s Neptune, the Microsoft Graph Engine, and the Linux JanusGraph. Graph Technology is the backbone of Facebook and LinkedIn. It’s also used to visualize complex data sets and to create visualizations like the ones below:
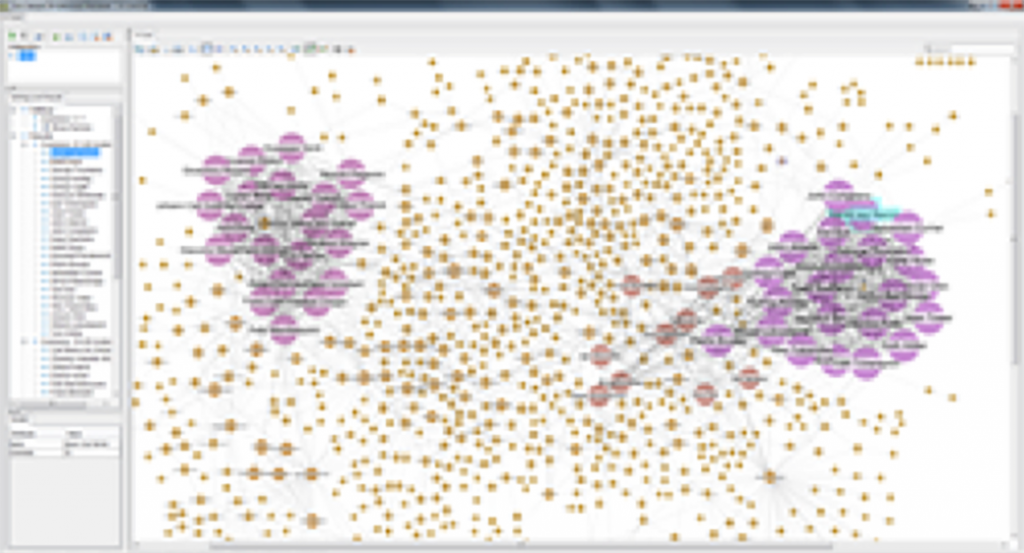
Above is a visualization of a real company using https://ograph.io.
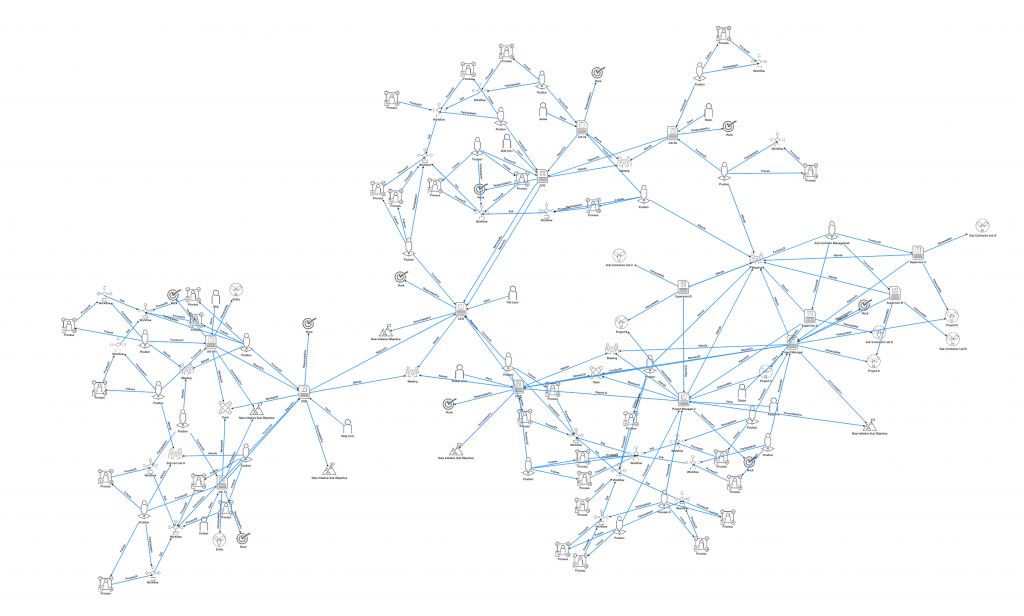
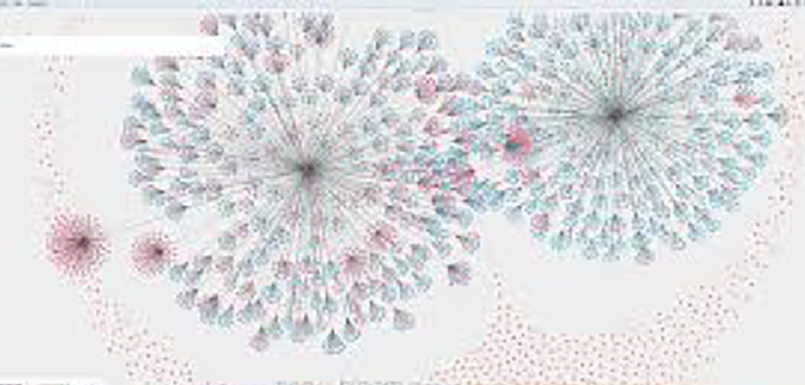
Above is the same company’s Org Graph, just utilizing a few different view / layout options. They can be color coded for clarity.
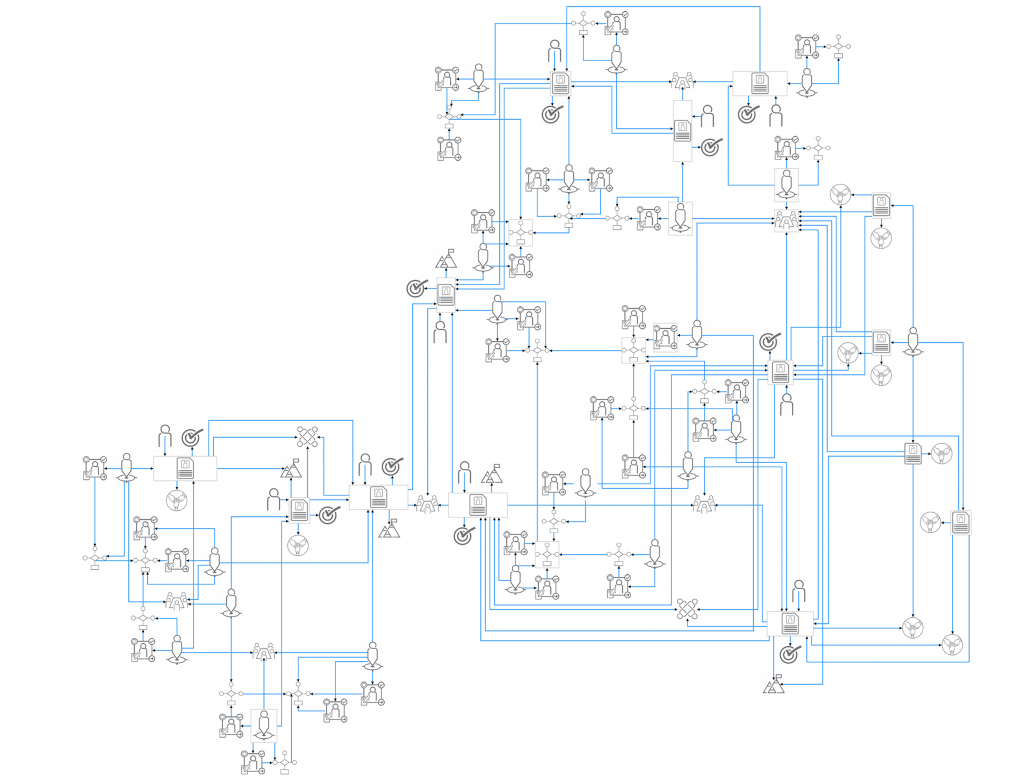
Above is the simple view of a classic org chart – yes, https://ograph.io has this view too.
7 QUESTIONS, 7 PROMISES, 1 ORGANIZATIONAL GRAPH
Before we move on from Jobs and Positions to a discussion of other key Nodes in the Organizational Cognizance Model, I want to return for just a moment to the Seven Questions and Seven Promises critical to cultivating engaged team members, detailed in my book, The Patient Organization. Over many years of coaching organizations, specifically polling and picking the brains of millennial ICs and doing all manner of soft-skills research, we arrived at the Seven Fundamental Questions that every team member wants to say yes to. Those questions are listed in the left-hand column below. The column on the right lists the corresponding answers organization must have to enable the Seven Promises that transform any organizations that has the guts to make and keep them.
| The individual must say yes absolutely | The organization must say yes absolutely | |
| 1. Do I belong? (I fit the organization’s core values and have the skill needed for my Job and Positions). I Belong. | 1. We have clearly defined our core values and the skills necessary for every Job and Position are clearly laid out. | |
| 2. Do I believe? (I am motivated by the mission and the strategic direction leadership is taking). I Believe. | 2. We know our Why, our Focus, and have a clearly mapped out strategy with priorities determined, laid out and shared. | |
| 3. Am I Accountable? (I understand and embrace the Purpose of my Job and Positions, what I should be thinking and doing). Yes, I am Accountable. | 3. Our Accountability and Responsibility structure is clear. See the Organizational Cognizance Model 14 Point Checklist. | |
| 4. Am I measured well? (I understand and embrace how and why I am measured, I know what a good job is and agree with the metrics). Yes, I understand and embrace how I am Measured. | 4. We have metrics, Objectives and Key Results for team members that inform them, giving them the latitude to form strategies to achieve these OKRs. | |
| 5. Is my opinion is heard? (I understand and embrace how my organization listens and how I my opinion is heard.) Yes, I understand and embrace how I am heard. | 5. We have clearly mapped out and defined the communication channels we use to listen and communicate – our meetings, mentoring, etc. – build trust, spur debate and help our ICs grow. | |
| 6. Am I being developed? (I understand and embrace how my organization offers opportunities for development and I take an active role in my own development) Yes, I understand and embrace how I am developed. | 6. We have clearly mapped out systematic development pathways for employees to participate in for their own development. This includes a combination of On-The-Job training, formal training, mentoring, coaching and accountability. | |
| 7. Do I have balance? (I understand and embrace what the organization’s definition of balance is from a work-life, health and compensation perspective.) Yes, I understand and embrace how my balance is maintained. | 7. We have taken the time to clearly define and communicate what work-life balance is to this organization and have communicated it up front with everyone. We have clear paths for employees to follow to maintain health and wellness balance and our compensation structures are clear and out in the open for the ICs to consider. |
When ICs are answering yes wholeheartedly to these Seven Questions and organizations are diligently keeping these Seven Promises, you have Organizational Cognizance. I won’t belabor the 7Qs and 7Ps here, since I delve deeply into each of them, including the neuroscience, psychology and “heavy lifts” that help organizations get to yes, in The Patient Organization. Readers can get the 30,000-foot view of Organizational Cognizance in that book (and a more basic introduction at www.7q7p.com).
Death of the Org Chart is designed to be a practical companion to my earlier book, bringing the birds-eye view down to the ground and zooming in on the complicated pivotal question, number three. This question requires the IC to say, Yes, I am Accountable. I understand and embrace what I am Accountable for. I understand the Purpose of my Positions, what I should be thinking and doing (remember the ultimate business question Peter Drucker supposedly uttered on his deathbed that we began the book with: Who is doing what? Now, it becomes, what Position is doing what?). It requires the organization to promise: Our Accountability and Responsibility structure is clear.
A quick sidebar about Accountability and Responsibility:
I should explain here that in my coaching and writing, I draw a distinction between “Accountability” and “Responsibility.” You are Accountable for thinking – planning, considering, assessing a decision’s potential impact. You are Responsible for doing – acting, executing, producing. Agreeing on these terms allows leaders and team members to clarify Accountabilities and Responsibilities. Do you understand and embrace both what you are Accountable for thinking about and Responsible for doing?
| RACI – This also ties to the usage of the words in the popular RACI model, where you map to Responsible Parties, Accountable Parties, Parties that need to be Consulted and Parties that need to be Informed. We are in essence capturing this approach in our OCM model, just in a much more detail that includes deeper context to understand why this Job or Position needs to be involved. |
This book arose partly from my realization that ICs and organizations were often far from a yes on Accountability, that they couldn’t see just how far from yes they were, and that the reason for this gap had everything to do with the inadequate and dated tool known as the Org Chart. Mention “Accountability” at most organizations, and people immediately reach for the old-fashioned Org Chart (and millennials cringe to see that it’s bandied about on paper). I hope that our discussion of Positions demonstrated the Jobs-based Org Chart’s massive shortcomings when it comes to clarifying Accountability in any way that’s meaningful to ICs’ daily work.
The Org Graph, with its flexible, dynamic view of Nodes and Edges, is much more functional. It grew from a combination of my desire to fill the gaping holes left by the old Org Chart (the desire to have ICs who are not just Accountable or aware, but Cognizant) and from my stumbling onto Graph Database technology. Without getting too technical, the same software technology we’re using to visualize the Org Graph is used for lots of applications dealing with networks and relationships. Think of those amazing bubble charts you’ve seen showing groupings and connections – of devices, crime, income, voters, diseases. Medical officials use this technology to trace pandemics and Facebook uses it to follow networks of friends.
At its most basic level, the Graph has two elements, Nodes and Edges. Each Node represents an entity (in the Organizational Cognizance Graph Data Model, that means a Person, Job, Position, Meeting, Process, Workflow, etc.), and Edges indicate how Nodes are related (in the Organizational Cognizance Graph Data Model, that means: ReportsTo, MentoredBy, Attends, InteractsWith, ResponsibleFor, etc.). Details, attachments, videos, and file links coupled with Rich Text editors are built into each node for a colorful universe of information you can expand or contract with a click of a mouse.
Under the hood, things become much more complex, but this is about as technical as we need to get. The important point for our purposes is that, unlike other types of databases, with the Graph, relationships have primacy. They are every bit as important as the data records themselves. This is an important feature for achieving Organizational Cognizance, which depends on Individual Contributors understanding at a deep level exactly how they fit into the organization and relate to its many Systems, Processes, Mentors, Bosses, etc. on a daily basis.
GETTING YOUR HEAD AROUND
KEY NODES AND EDGES
As we delve into the Organizational Cognizance Graph Data Model’s specific Nodes and Edges, I will caution readers not to get too ambitious or ahead of themselves here. I’ve presented the Organizational Cognizance Model and Org Graph software enough to know that people immediately want to consider how it can be used from a management or leadership standpoint – an approach that can cause confusion. Though the Org Graph and Organizational Cognizance Model have a wide range of possible uses, keep it simple and begin by thinking, as I advised in Chapter 1, from the perspective of a new IC starting work. You share the Organizational Cognizance Model and her Org Graph with this new person, and she very quickly knows how to navigate the organization, what she is Accountable and Responsible for, who she communicates with for each position, who will mentor her, what workflows she is a part of, etc. She won’t achieve Organizational Cognizance right away, obviously, but she should hit the ground pretty damn aware by the end of that first week.
As I mentioned, we’ll go through the mechanics of defining Positions, writing Position Purpose Statements, filling out a Position Capture Worksheet, etc. in Chapter 3, on facilitation. Once ICs have done that work, they map, with the help of colleagues and close supervisors, the key Nodes and Edges listed below to build out the Org Graph.
USING THIS SECTION OF THE BOOK AS A REFERENCE
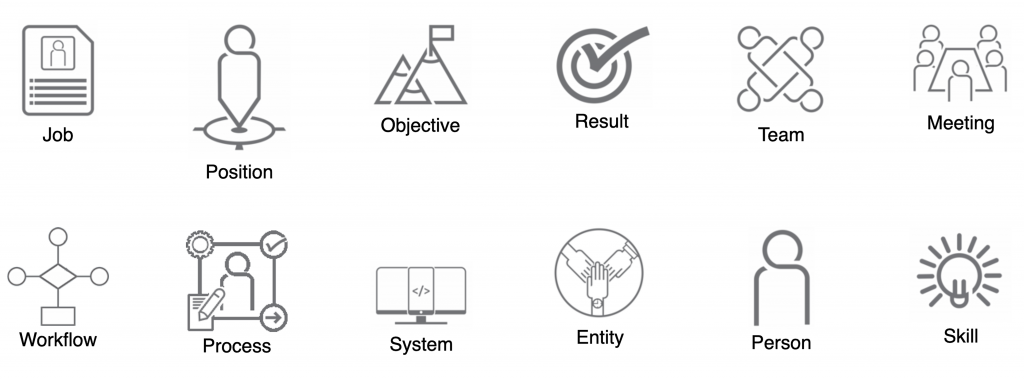
- Next to each Node is the icon that represents it in our Org Graph software, though, as I’ve said, the software is only one available tool, and the Organizational Cognizance Model doesn’t depend on it. Readers can use whatever means they’re most comfortable with to visualize their own Org Graphs.
- Below each icon will be a paragraph, a written description describing the Node.
- Below each of the Node written descriptions are graphics of its accompanying Edges. These graphics are screenshots from our software. They give a small taste – the best we can do on paper – of the ways that Nodes and Edges can be visualized in the Org Graph to build Organizational Cognizance and help ICs figure out where and how they fit. Edges are printed in bold in the paragraphs below and represented by arrows that indicate the type of relationship, or connection, between Nodes in the Graph. Those arrows can move in either direction, and follow specific rules depending on the nature of the connection.
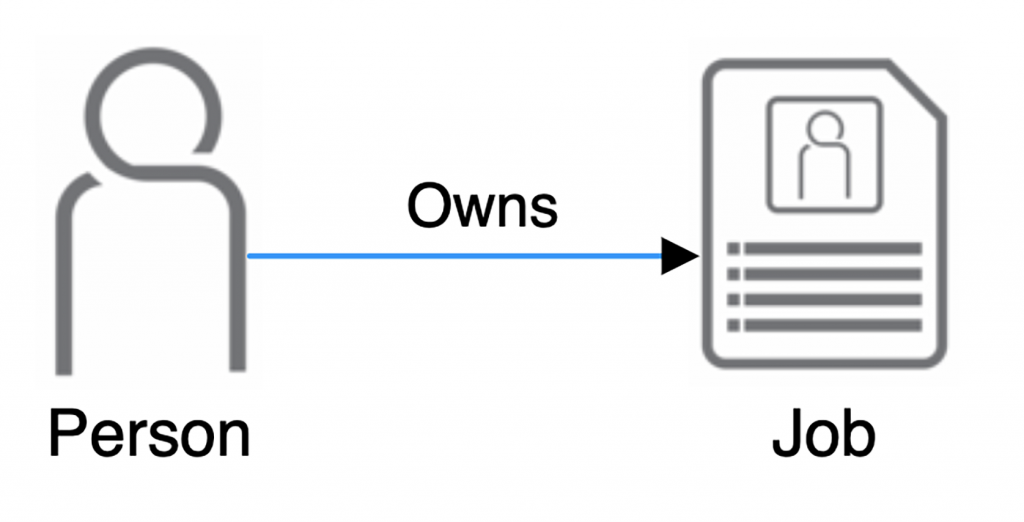
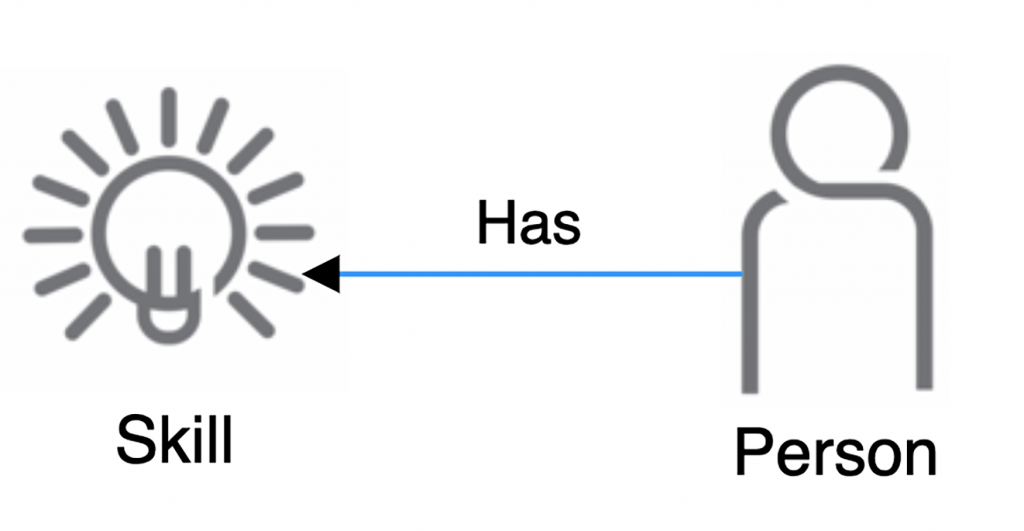
![]() PERSON: This is obviously the key component of any organization. The Organizational Cognizance Model always starts with and revolves around the person. The person Owns a Job. “Owns,” as you can see from the graphic below is an “Edge,” indicated by the arrow leading from the Person icon to the Job icon. We can personalize the Person Node with images and links to give it more life than just a name.
PERSON: This is obviously the key component of any organization. The Organizational Cognizance Model always starts with and revolves around the person. The person Owns a Job. “Owns,” as you can see from the graphic below is an “Edge,” indicated by the arrow leading from the Person icon to the Job icon. We can personalize the Person Node with images and links to give it more life than just a name.
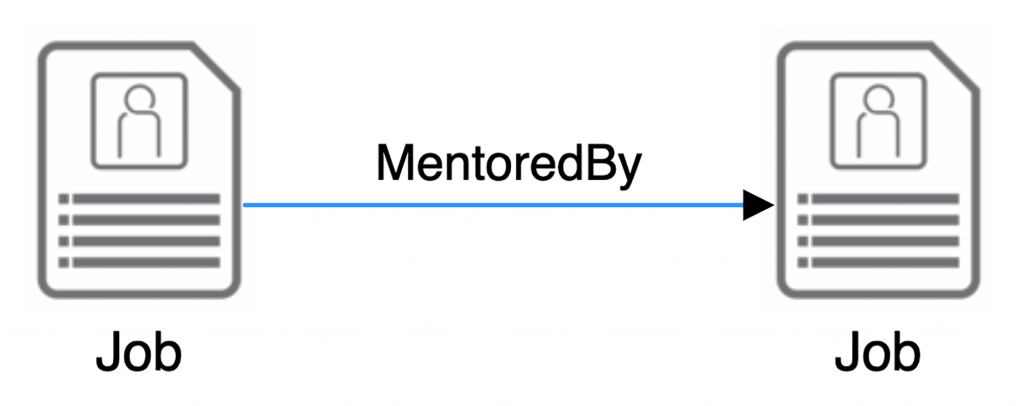
 JOB: We all know what jobs are, but in the Organizational Cognizance Model, we want to focus on the notion that a job is made up of various Positions. There are two Edges we must define for Cognizance. First, obviously, a Job ReportsTo another Job / Boss. This is a key Edge and, amazingly, the only piece of information from the Org Graph captured in the classic Org Chart. The second is MentoredBy – one’s boss is not always his or her Mentor. I break the words Mentor and Coach apart. A Mentor is someone you turn to in confidence for guidance about your career or path in the organization. Ad-hoc Mentorship is not effective – spelling these relationships out is key. Consider a time when you worked somewhere, and your ad-hoc mentor left for another company. “Well, what am I, chopped liver?” you wondered, after all that time spent building a relationship that’s now gone. Your second thought might have been, “I guess I better follow them…” Being overt about Mentoring is super healthy. A Job description, handbook, and other relevant material can be embedded, or uploaded in each Job Node and colored using Rich Text.

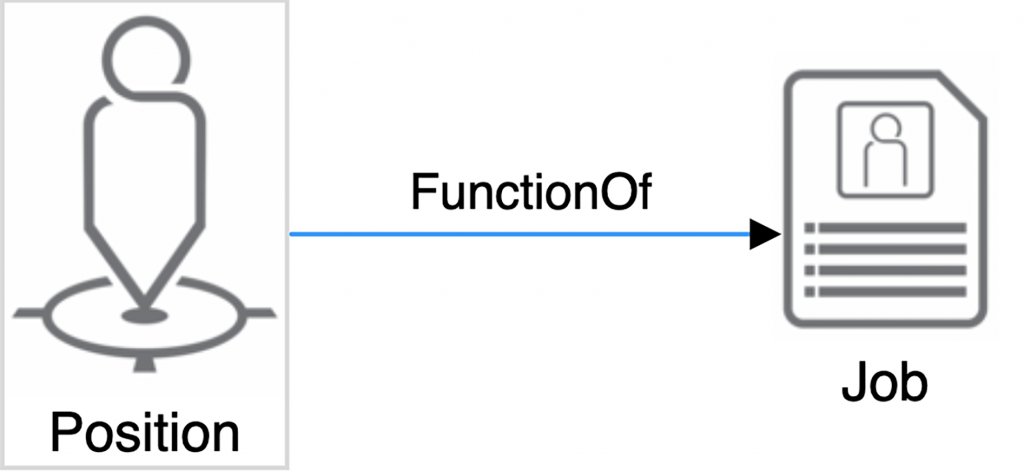
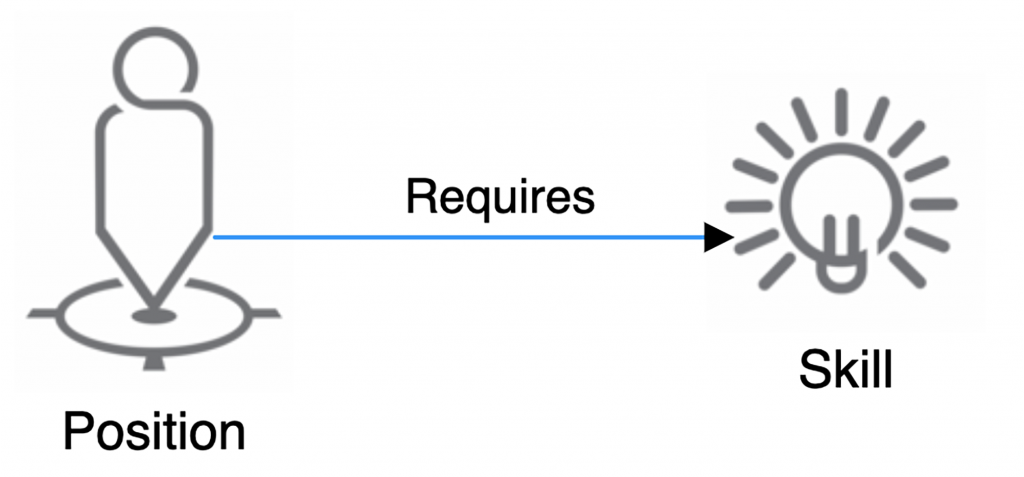
POSITION: We have spent a good portion of this book so far explaining Positions and how they work in the Organizational Cognizance Model. Each Position is a function of a particular Job, so, in the Org Graph below, you can see that an Edge labelled FunctionOf points from the Position to the Job. In our basic Graph and starting view, the Position is the center of the universe (Org Graph views can be manipulated almost endlessly to clarify or emphasize relationships, a topic for later). Each Position is like an anchor and home for ICs, the vantage from which they see everything and the means through which they relate to all the Nodes that follow. The first Edge, or connection, for a Position is that it’s a FunctionOf a Job, as noted above. The other Edges attaching Positions to various Nodes will be detailed according to the remaining Nodes below.
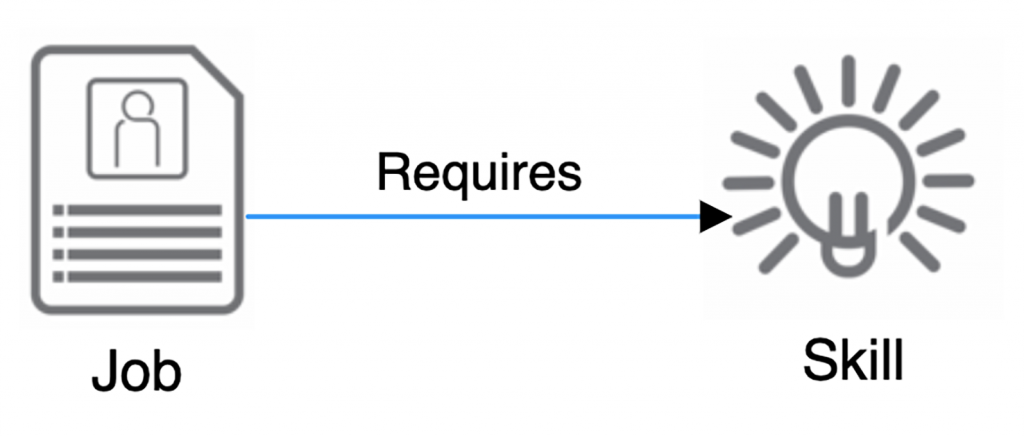
SKILLS: Skills refers to the talents, abilities, and knowledge that qualify someone to do a Job or fill a Position. Degrees, certifications, licenses, etc. are not Skills but often indicate a set of necessary Skills. For instance, someone certified as a Microsoft Office Specialist should have the Skills to comfortably navigate Office programs. Other Skills, such as “effective communicator” are harder to quantify and are sometimes labelled as “soft.” Two key Edges build Cognizance around Skills in an Org Graph. A Person Has Skills and a Job / Position Requires Skills. The gaps between these two Edges spell out for the IC and the organization exactly where someone might need work, Mentoring, training, or education. They highlight ICs who are overqualified for their Jobs and make good candidates for advancement, and they illuminate the path forward for ICs who want new challenges. If they’re interested in Positions B and C or Job X, ICs can simply pull up the Org Graph, click on Skills for a Position or Job, and see exactly what they need to work on to get there. An employer can embed text, video, and links right inside a Skills Node, giving an IC direct access to training videos, online courses, manuals, etc. An IC can attach a CV or resume, links to certifications, degree programs, previous employers, etc, inside their Person node.
Bonus: Workforce Planning and Learning Management. Think about the Skills Nodes as a possible backbone for your LMS (Learning Management System) and as a Workforce planning tool. This utility was pointed out to me by Keith Langbo, of Kelaca. Keith’s organization works with companies to define the skills / competencies required for different Positions and then matches the person with that level of mastery to the Position. Kelaca includes this in their KTAP (Kelaca Talent Advisory Program). For instance, Kelaca might rank someone as an MSExcel5, meaning he or she has demonstrated the top level of understanding and mastery of Excel. A Position may have a need for someone with MSExcel3 or higher, meaning a strong proficiency in Excel but not necessarily at the expert level, so this allows the team to identify people with the right skills for the right positions & jobs, and can identify and lead towards resource development & training opportunities. Kelaca calls this part of their program, the KVPA or Kelaca Visual People Analyzer. This same tool & data can be utilized when looking at potential succession planning as part of the overall workforce planning efforts.
Imagine if each Skill Node contained the actual training material or a link to a system that administers the training, all right there in one place.
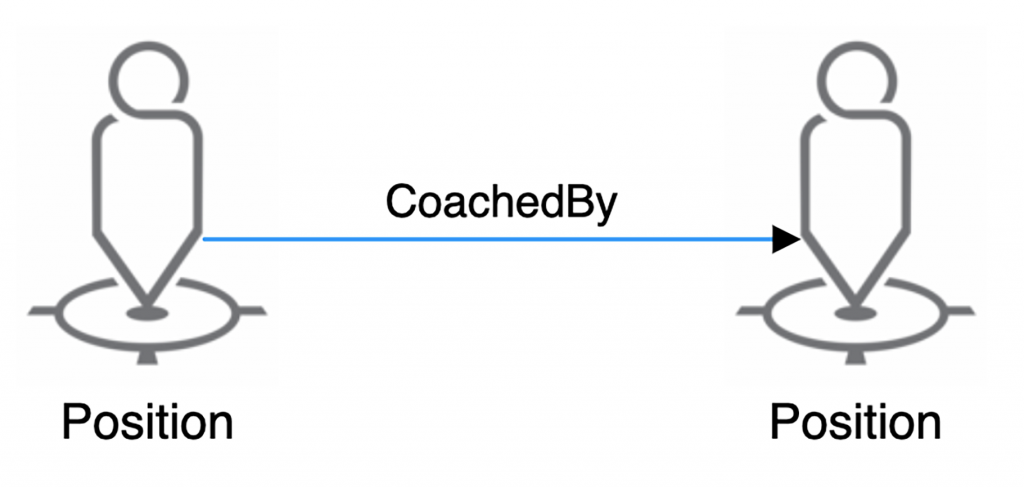
COACH: Yes, we map this as another Position. Who do I turn to with questions about my Position? In my experience, this Node is neglected even at the best-run organizations. Sometimes Coaching is an afterthought, and leaders simply assume it will happen (it won’t, not adequately). Often, Coaching falls under an HR Job in charge of training or administration of the Learning Management System, but the person holding it doesn’t know anything about 90 percent of the Positions ICs hold. Often, an IC has no clear idea who to turn to for help. The answer is Position Coach in the Organizational Cognizance Model, where Positions Coach other Positions. For instance, a new university accounting graduate gets a Job at a CPA firm, and her Job title is Staff Accountant. On a CPA Audit team, a Staff Accountant’s Job might include the Position of Inventory Auditor. This Position is also held by an Advanced Staff Accountant – we would create Coaching Cognizance by linking these two Inventory Auditor Positions with the connection label (Edge): CoachedBy. The Org Graph spells out clearly who each Position is CoachedBy, guaranteeing clarity and speeding up the amount of time it takes to get to ROI.
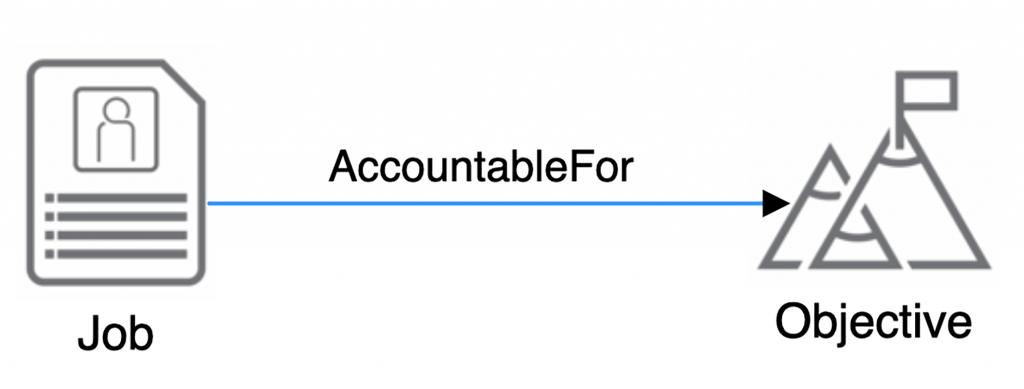
OBJECTIVE: Objectives are the big-picture things we’re aiming for, at the strategic level, and tend to be more qualitative than quantitative. (Note: when it comes to Objectives, the Organizational Cognizance Model ties into a strategy that Intel developed and Google extended called OKRs, or Objectives and Key Results. In essence, all strategic thinking is a cascade model, and you can use Organizational Cognizance and the Objectives and Results nodes to capture and visualize this type of thinking even of you don’t follow OKRs exactly.). As I have explained, in the language of the Organizational Cognizance Model, we are “Accountable” for thinking when it comes to Objectives – planning, considering, building strategy, executing, making it happen, etc. – so the Edge for each “Objective” is labelled AccountableFor. Jobs can be AccountableFor Objectives and Positions can be AccoutableFor Objectives. Often in the OKR approach, there are “master Objectives” and “sub-Objectives,” smaller Objectives that Support larger Objectives. If one Objective Node involves a new product, links to product info, marketing materials, sales targets, etc. can be embedded in the Node.
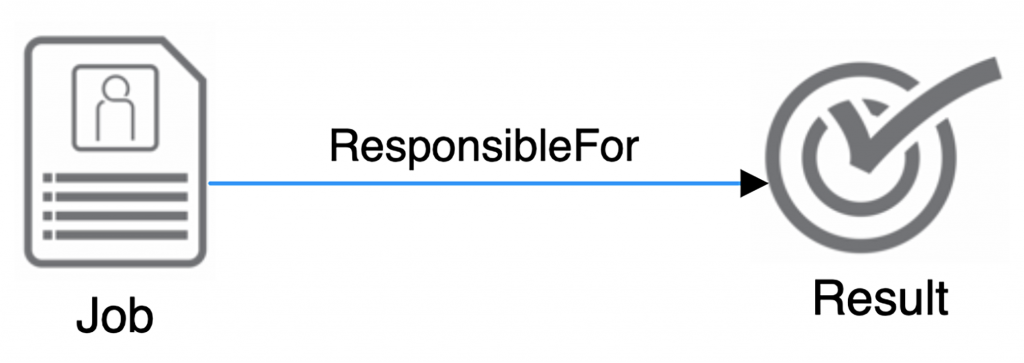
KEY RESULT: We are Accountable for thinking about Objectives, but Responsible for the actions that achieve Key Results. These Results are quantifiable – could include hitting a particular sales volume, retaining a higher percentage of clients, boosting website visitors by a certain number each month. The Edge connecting a Job or Position to a Key Result is labelled ResponsibleFor. In the OKR world, the basic measurement, the thing that has to be achieved, is the Key Result. Here, we are linking Key Results and Objectives with the edge, “Enables.” No, you do not have to be following OKRs to make Results and Objectives come alive. They are part of basic strategic thinking.
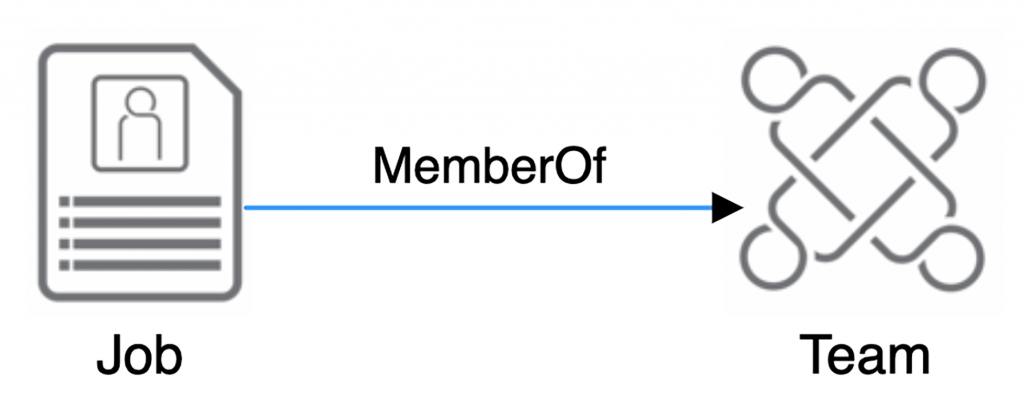
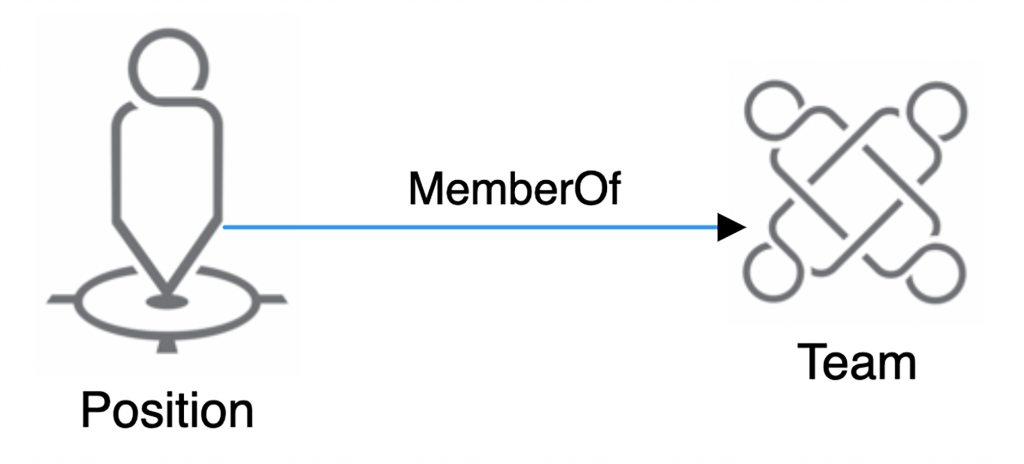
TEAM: Data shows that the popular shift from hierarchical to more Team-centric models can improve performance, but according to a recent Deloitte survey, only 6 percent of respondents rated themselves very effective at managing cross-functional Teams. A major advantage of the Org Graph in today’s environment is the ability to quickly display and manipulate “Team” Nodes. The Edge called MemberOf defines the relationship of a Position or Job to the Team that it’s on.
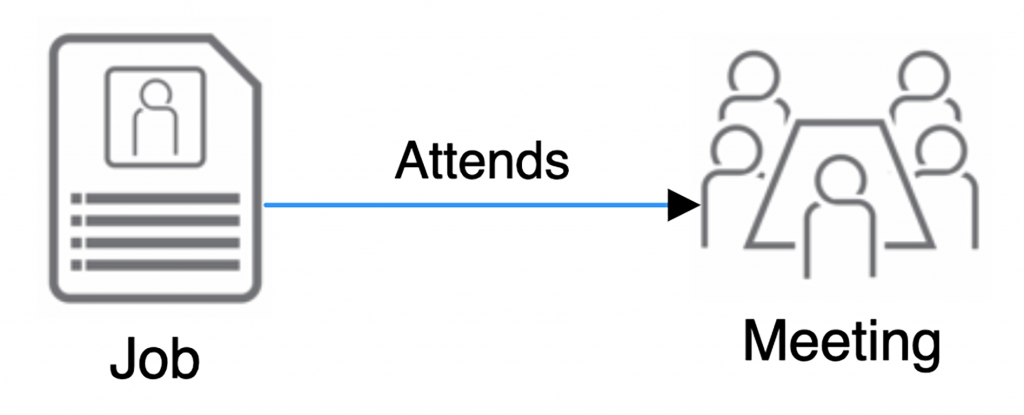
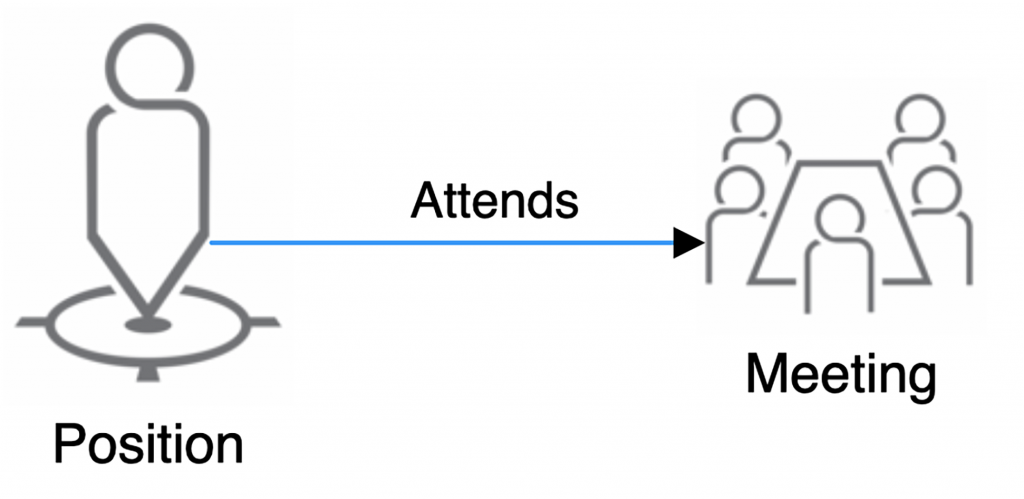
MEETING: Meetings are an endless source of confusion and frustration for ICs. The Org Graph lays out visually exactly which Positions or Jobs Attend which Meetings. Note that it’s the Position or Job, not the Person, that has the connection to, or Edge with, the Meeting. The IC can see at a glance that because he holds a Job called Sales Rep and is a Member of Team X, Participating in Workflow Y, etc., of course, he attends Meeting Z. All meetings should have a clear Purpose and Agenda, as I describe in The Patient Organization, but the starting point is getting every IC to understand how and why particular meetings matter for their Jobs and Positions, how they fit into the organizational fabric. The Org Graph is also a great tool for quickly spotting Positions or Jobs that should no longer be Attending certain Meetings – plus the useless Meetings that should be put to a quick death. A standing description of a Meeting can be embedded in a Meeting Node, and all relevant paraphernalia can be linked or attached – agendas, scorecards, to-do lists, etc. giving all ICs easy access.
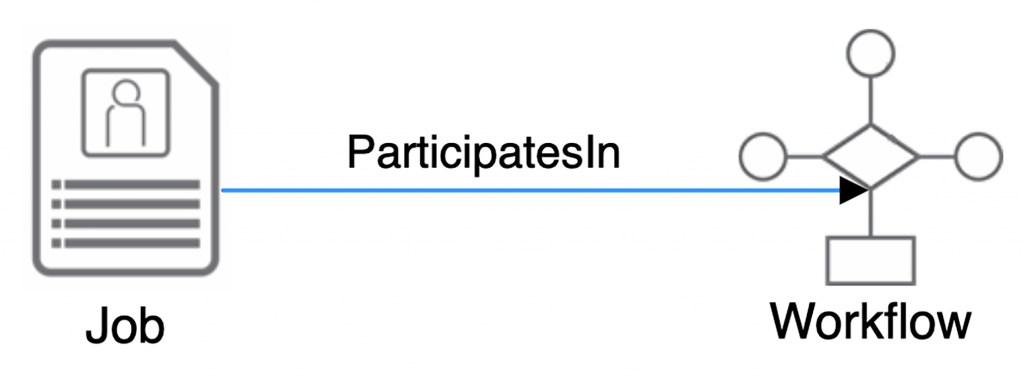
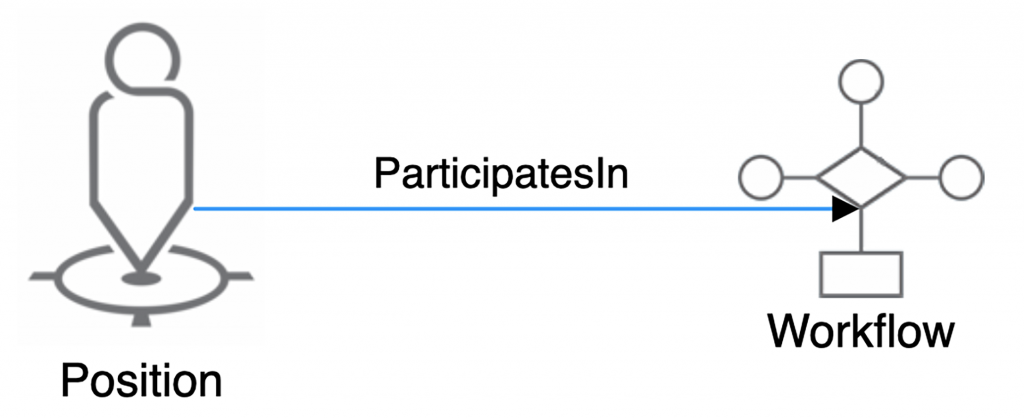
WORKFLOW: “Workflow” refers to the steps involved in passing tasks or information from one IC to another or one system to another for action according to procedural rules as value is added to the organization’s activities. Workflows have become more and more digitized and automated, so much so that they have become what I refer to as “invisible workflows”, a trend that continues apace. This trend has added efficiency and saved organizations money, but it also can make these Workflows invisible and make ICs feel removed from and confused by the Workflows they’re supposed to ParticipateIn because they cannot see the links in the chain any longer. The Org Graph once again ties the Workflow to the Position or Job, not the Person, to clarify how and why she ParticipatesIn it. We have two Edges for Workflow, the second is Sub. Sub means there is one Workflow that supports or flows into another Workflow. We can map and visualize these connection via our Graph.
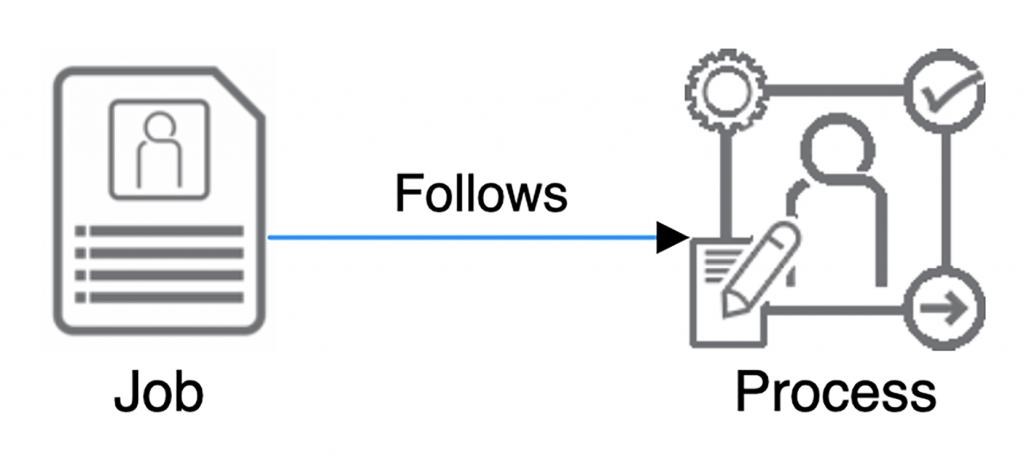
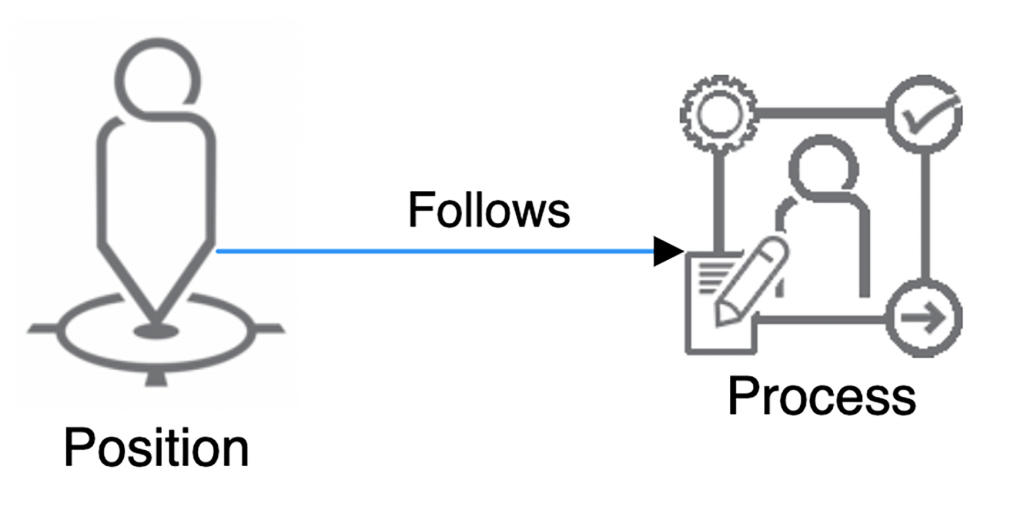
PROCESS: A “Process” is usually attached to a Workflow as well as to a Position or Job. As you Participate in a Workflow, step one might be to Follow Process A, step two requires Process B, etc. The Org Graph allows you to see the overall Workflow, as well as the Processes your Position Follows while Participating in that Workflow. The basic Org Graph below only shows a one to one Process connection – a Position or Job Follows a Process – but in reality it is a one to many situation, with a click of the mouse you can follow the edges and see who all is also attached to this process, very important when it comes to changing a process, we need to consider all parties involved with it, and upstream and downstream from it. Our software can display or hide other Edges leading from a Workflow to all its related Processes. Here once again, links to videos, photos, diagrams, handbooks, etc. embedded in the Node for a complex Process can be invaluable for the IC.
Note: not show below is the Maintains edge, an important edge, we need to be able to see who has the domain and authority to update and maintain Processes.
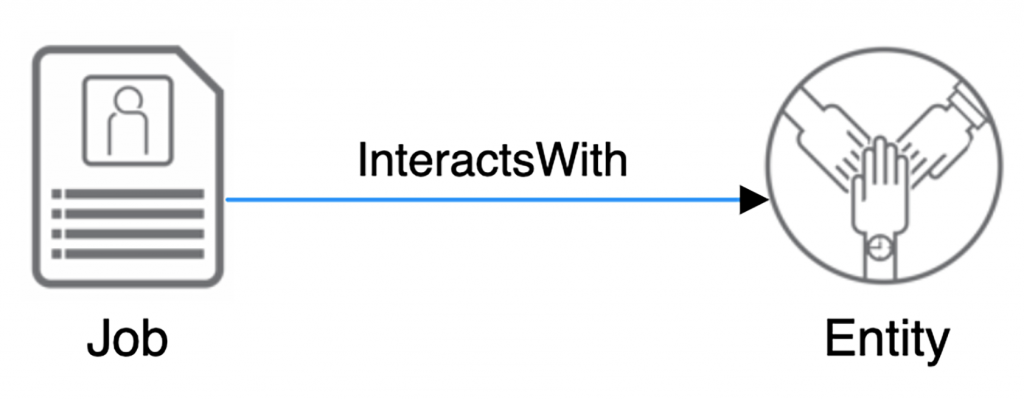
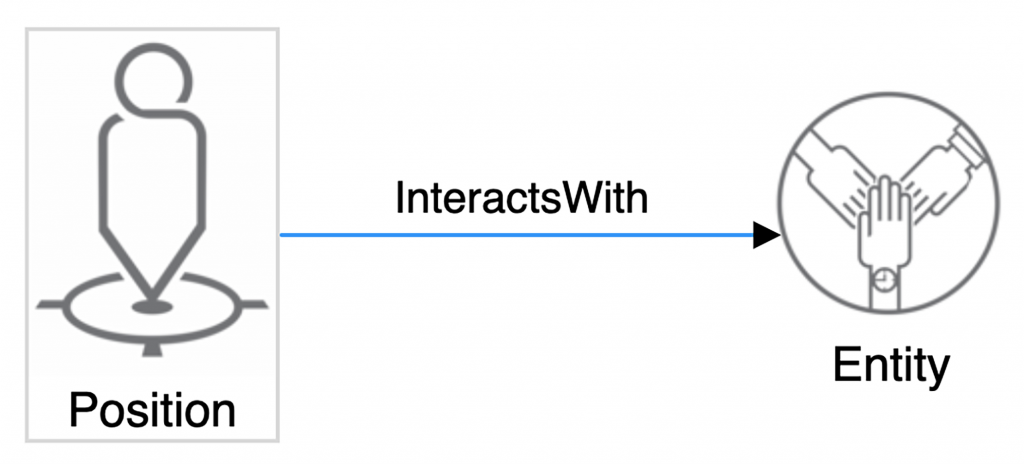
![]() ENTITY: This is a broad group that captures a lot of thinking. Typically, an Entity is an element outside the organization proper or outside of the IC’s functional unit, in internal customer for instance. A customer, vendor, contract or project could all be represented by an Entity Node. Likewise, if you’re in Engineering but must deal with ICs in Field Surveying, this would be represented in your Org Graph as an Entity you InteractWith. We also use an Edge called BelongsTo in order to link Entities to Entities. One way to think of this BelongsTo edge is to capture the components of a large project with sub-projects. We can also use it as a map of the people in an external organization we InteractWith, a kind of level-to-level map that answers the question, who is InteractingWith whom at client X? Imagine being able to share this detail with a confused client or IC?
ENTITY: This is a broad group that captures a lot of thinking. Typically, an Entity is an element outside the organization proper or outside of the IC’s functional unit, in internal customer for instance. A customer, vendor, contract or project could all be represented by an Entity Node. Likewise, if you’re in Engineering but must deal with ICs in Field Surveying, this would be represented in your Org Graph as an Entity you InteractWith. We also use an Edge called BelongsTo in order to link Entities to Entities. One way to think of this BelongsTo edge is to capture the components of a large project with sub-projects. We can also use it as a map of the people in an external organization we InteractWith, a kind of level-to-level map that answers the question, who is InteractingWith whom at client X? Imagine being able to share this detail with a confused client or IC?
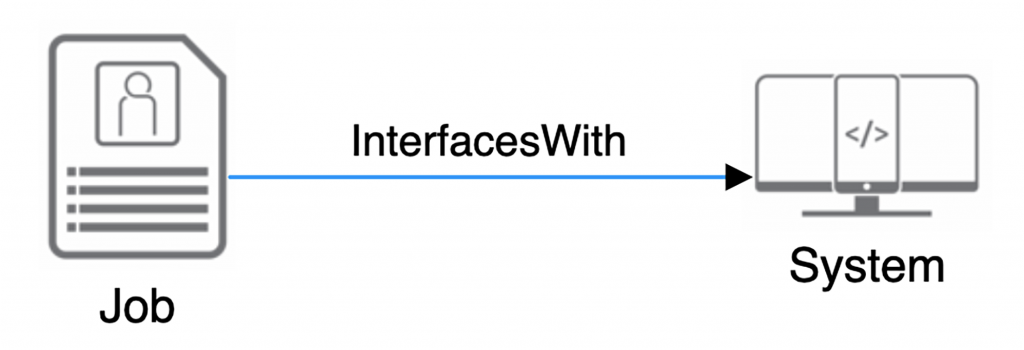
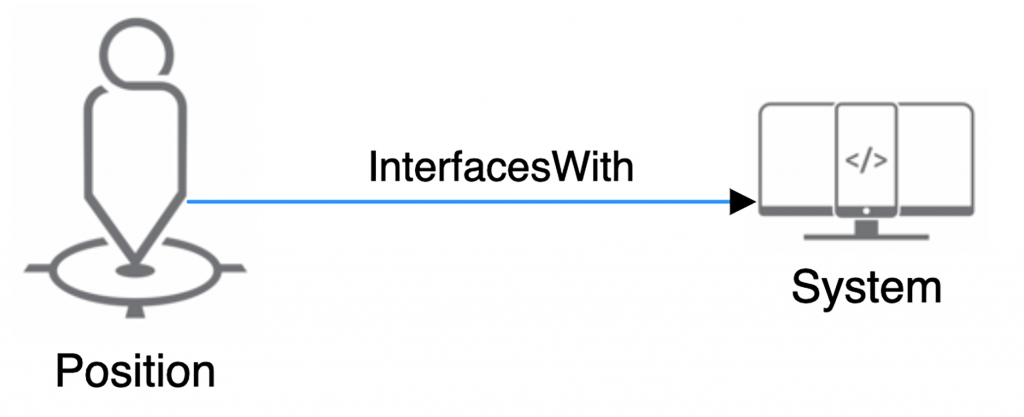
SYSTEM: In Organizational Cognizance Model language, we InteractWith Entities and InterfaceWith Systems. Again, since we’re dealing with the limitations of print here and trying to keep things simple as we introduce concepts, the graphic below shows only one Node labelled “System.” In 21st-century organizations, ICs often Interface with dozens of Systems, as we saw in the previous chapter, and a mouse click can display them all, with clear connections, or Edges, in our Org Graph. Generally, a system is any element – often digital these days, though not necessarily – in which an IC inputs data or work to have some function performed or info tracked. Salesforce.com, Quicken, the shared Excel spreadsheet a facilities manager uses to track building repairs, Google Hangouts – all qualify as Systems. Together, they often look like a fog-inducing bowl of alphabet soup to ICs, whose heads spin, trying to get a fix on HRIS, ERP, CRM, IMS, LMS…In an era of System proliferation, the Org Graph’s ability to visualize how ICs interface with and relate to our many Systems is invaluable. Links to training materials, instructional videos, support sites, guides, etc. can be embedded in System Nodes.
The descriptions above provide a basic overview to get readers started. They don’t detail all of the views that an Organizational Graph can display, yet consider what an organization would look like if every IC had even the simplest version of this tool at her disposal from day one. Immediately, she would know all of the Positions that make up her Job, who Coaches her, what Teams she is a MemberOf, and what Workflows she ParticipatesIn. She would be clear on the Objectives she’s AccountableFor, the Results she’s ResponsibleFor, all of the Meetings she Attends, and the Systems she InterfacesWith.
This IC would, on day one, understand in a meaningful way how she plugs into the organizational structure, how its key elements (Nodes) relate to her (through Edges), and to a high degree, how her work affects other team members and the overall organization. The Org Graph is a practical way to help all ICs understand three key elements explained in Holacracy: The New Management System for a Rapidly Changing World – Purpose, domain, and authority. As we’ll see in the next chapter, we create a Purpose Statement for every position, so ICs understand their why at a fine level. With the Organizational Cognizance Model and an Org Graph, ICs can also see what the appropriate domain, or sphere, is, not just for them personally, but for each Position they hold. They also know, within the context of their Positions, Accountabilities, and Responsibilities, exactly where their authority lies.
Developing this deep level of awareness into true Cognizance across the organization has a powerful, multiplying effect. Cognizance is cumulative. It accretes in beautiful ways. We call this the Organizational Cognizance Model, not the Worker Cognizance Model, because it’s about achieving a deep level of transparency, clarity, and Purpose throughout the organization. Yes, ICs who are Cognizant of where and how they fit will be more engaged, but Teams will also work in greater harmony. Departments should better understand how their operations affect each other. Purpose cascades through various levels, linking the IC’s Purpose with that of her team, unit, department, etc. – and with the overall organizational Purpose.
I dumped a lot of concepts and terms on you in this chapter, but I hope they grow clearer in the next, where we’ll delve into facilitation and execution. This is the fun stuff for me and my firm. We spend most of our year walking organizations step by step through the exercises that allow them to build an Org Graph and implement the Organizational Cognizance Model and method.
NODE / OBJECT ICON SUMMARY