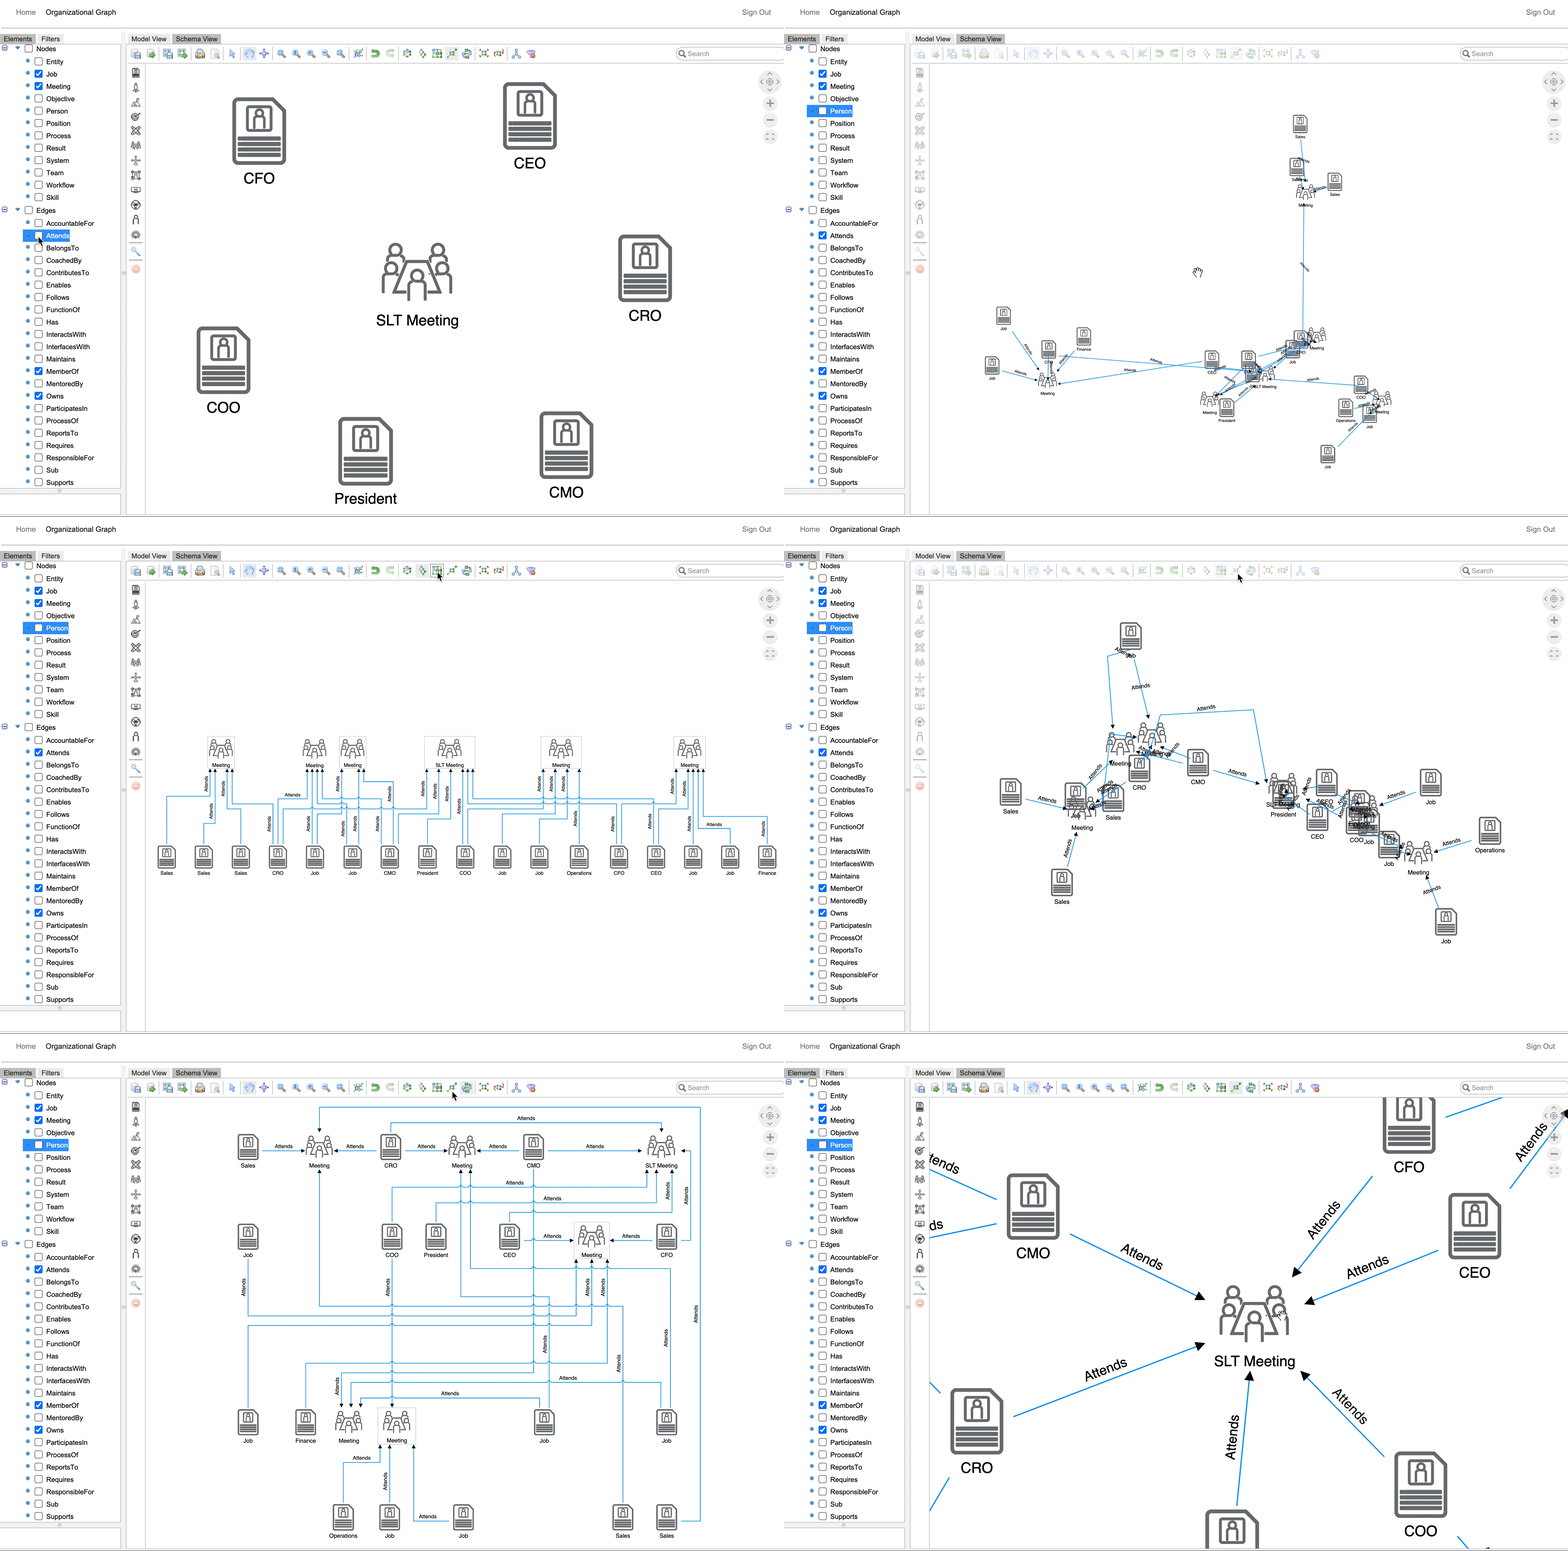
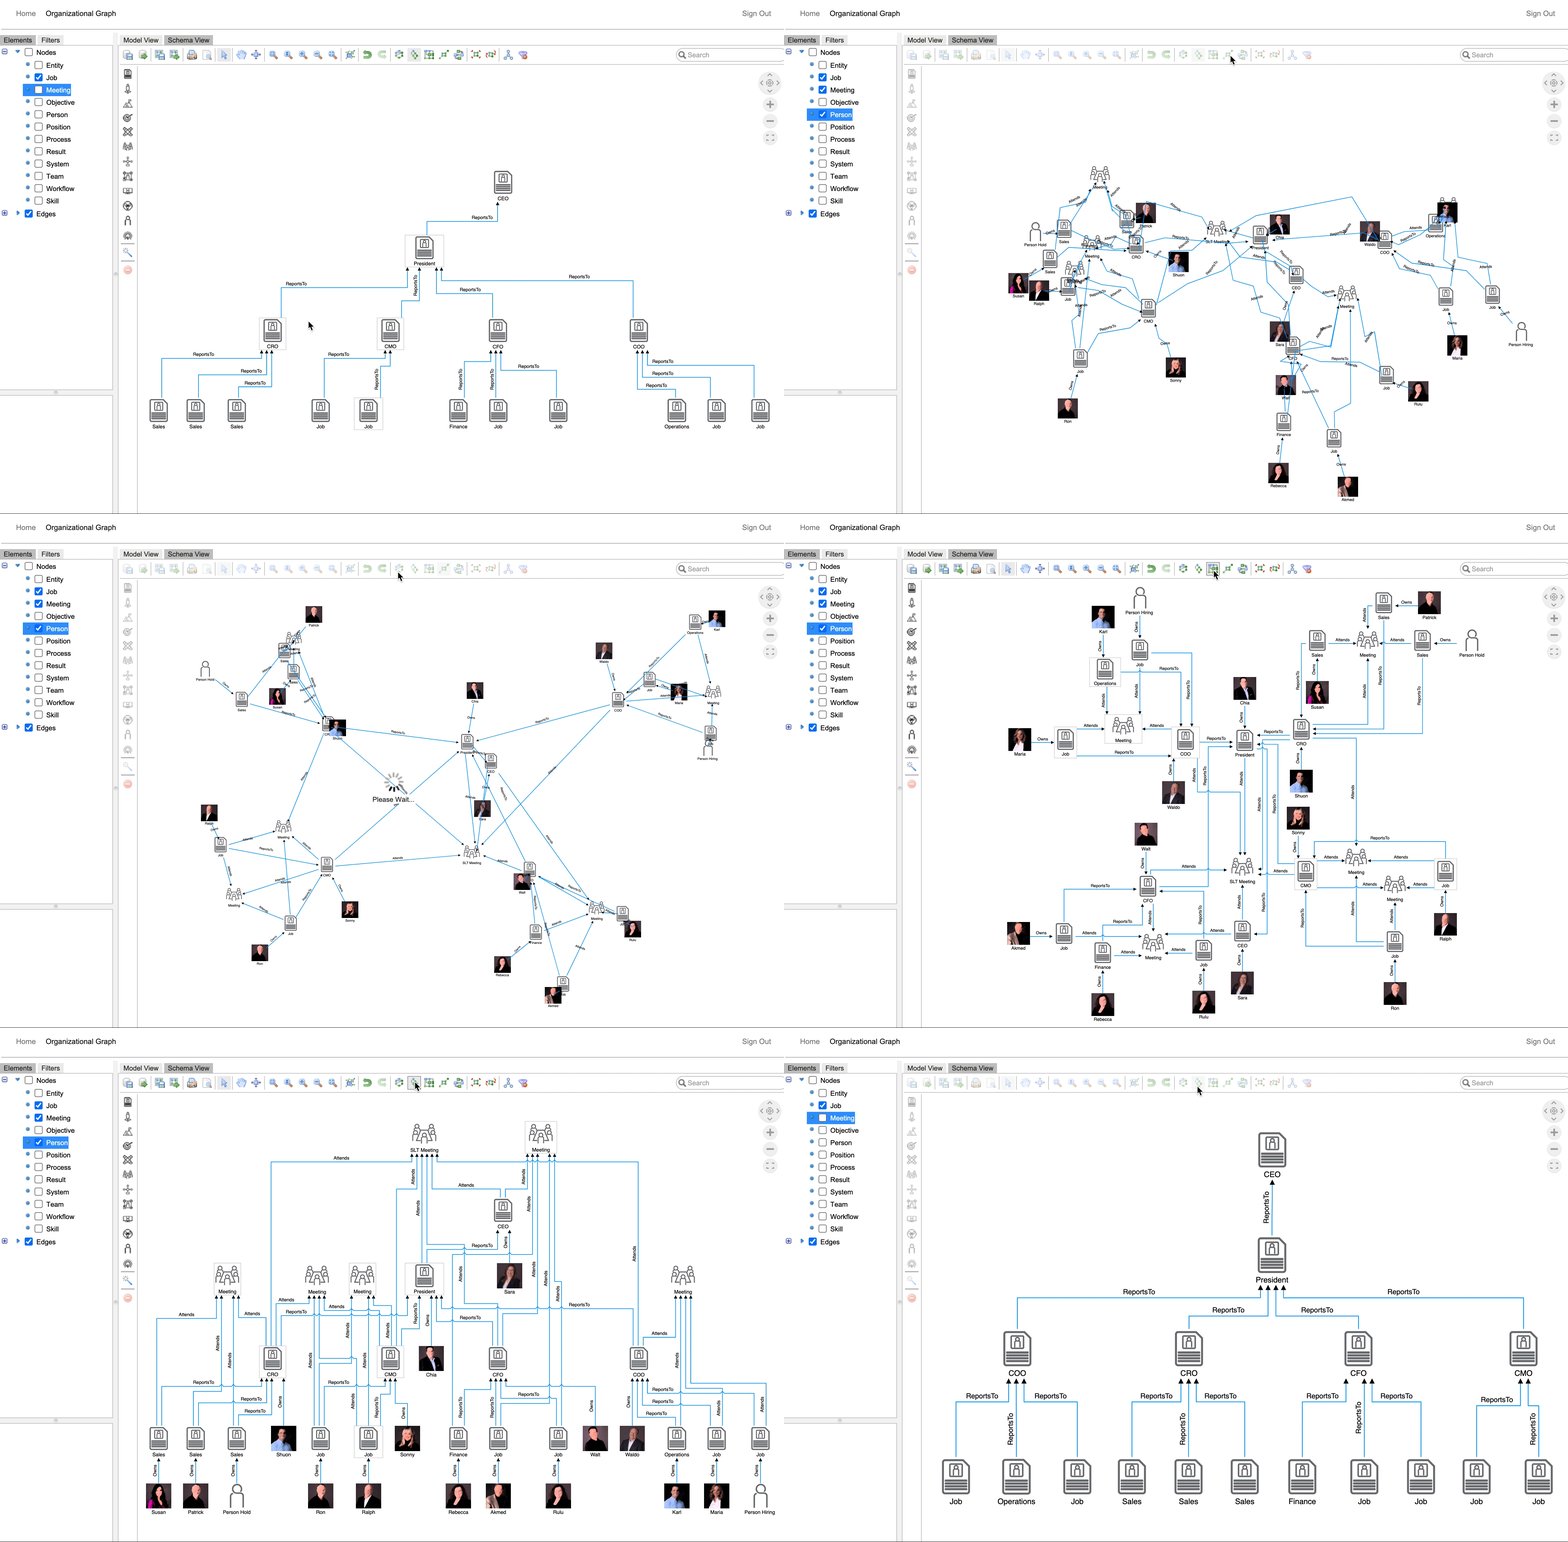
CEO: Who is in what meetings and why? Individual Contributor: What meetings am I in and why? Two very important questions that need to be asked every 90 days, a simple best practice.
Meetings, Garden Weeds and Rabbits.

Being able to link meetings to one’s organizational chart makes a lot of sense. In the organizational cognizance model we would like everyone to understand and challenge which meetings they are investing time in at least every 90 days.
Weeding out stupid meetings. Being able to visually take an organizational meeting inventory at least every 90 days is a very powerful habit to adopt. Like an untended garden, meeting weeds have a tendency to propagate like rabbits out of control, and if left alone will take over. Like bad habits, meetings can have a tendency to hang around way beyond their usefulness.
Humans are linked to the seasons, we are ready for a fresh start every 90 days. Pruning your meeting garden at these seasonal changes is very natural and often enough.

In the visualizations above we are using a sample organizational graph, limiting the view to Meetings and Jobs, with a flash of People to see how a simple organization can map their meetings to who is attending them, answering what meetings and why.
Being able to go directly from your Org Chart to a seeing your Meeting structure is a simple advantage of organizational cognizance and an org graph.
